This section deals with the use of ATCF to
accomplish everyday TC forecasting tasks. Most of the
information in this section is gleaned from JTWC’s
Standard Operating Procedures (SOPs), which are referenced
where applicable.
This information is adapted from JTWC
Equipment Standard Operating Procedure (ESOP) #02 and deals
specifically with the procedure for printing JTWC’s Area
of Responsibility (AOR) chart with associated data to the
plotter. The procedure is, however, easily adaptable to
printing any chart/graphic from ATCF.
-
Click on select map in
the Sidebar. The Choose Area dialog will be displayed.
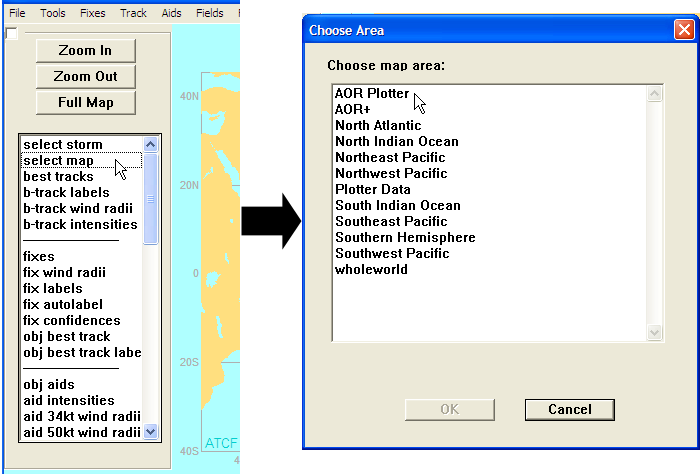
Selecting the AOR Plotter Map
-
Select AOR Plotter and
click OK. The AOR Plotter area will then
be displayed in the map window.
-
In the menu bar at the top of the
window, click on Fields. A drop-down menu
will be displayed.
-
Select Display Raw
Data… from the drop-down menu. A Choose
Data Types dialog will be displayed.
Choose Data Type(s) Dialog
-
Select the field data from the list
below. To select all items in one of these lists, hold down
the Ctrl key and click each item individually. Selected
items will be highlighted.
-
Once the items to be displayed for a
given chart are highlighted, click
Display. The data will now be displayed in
the map window.
-
Click OK to close the
Choose Data Type(s) dialog.
-
To remove a field already displayed,
click on Fields in the menu bar and then
Display Raw Data… in the drop-down
menu to open the Choose Data Type(s dialog. Click on the
field(s) to be removed (hold down Ctrl to choose multiple
fields) and then click on Remove to remove
the selected fields from the display.
-
To print the chart to the plotter,
select File from the menu bar and then
Print Graphic to Plotter from the File
menu.
2.2 Starting a Storm
This procedure is adapted from JTWC ESOP 02
and JTWC TDO SOP 07.
-
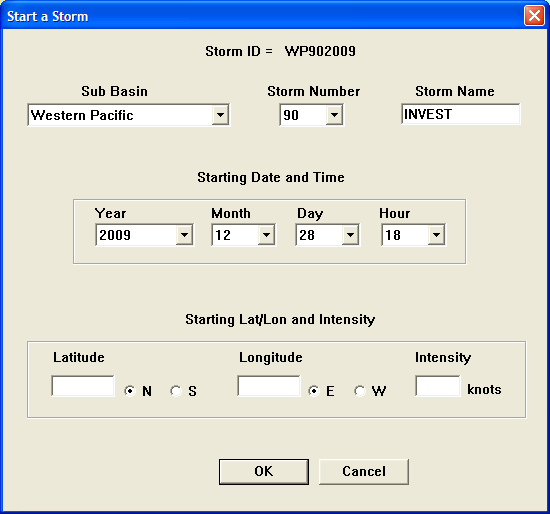
Click on Manage-Storms
in the Menu Bar above the map window. The Start a Storm
dialog will be displayed:
Start a Storm Dialog
-
Under Sub Basin click
the down arrow to select the Basin that the invest is
in.
-
Under Storm Number
select the next 90 series storm invest number acquired
while entering the storm on the SATOPS Invest # Page
(https://2058.5.40.24/investat.htm).
-
Enter the
Latitude and Longitude of
the current position. The N/S/E/W will change according to
which basin is selected, but double check to make sure.
-
Enter the estimated
sustained wind speed in the Intensity box.
Invests are started at 15 knots.
-
Click
OK.
-
Responsibilities: For
suspect areas east of 140°W and north of the equator
(NEPAC), the NOAA Tropical Prediction Center/National
Hurricane Center (TPC/NHC) is the official tropical cyclone
warning agency for opening and numbering suspect areas and
tropical cyclones, as well as for upkeep of NRL microwave
image invest windows. For suspect areas between 180°
and 140°W and north of the equator (CPAC), the Central
Pacific Hurricane Center (CPHC) is the official tropical
cyclone warning agency for opening and numbering suspect
areas and tropical cyclones. For suspect areas west of the
dateline (180°) and north of the equator and all
suspect areas south of the equator, JTWC is responsible for
opening and numbering suspect areas and tropical cyclones,
as well as the upkeep of NRL invest windows. JTWC, TPC/NHC,
and CPHC will adhere to the following guidelines for
initiating suspect areas.
-
JTWC is responsible
for opening and maintaining/closing invests west of the
dateline (180°) and north of the equator and for
all invests south of the equator.
-
TPC/NHC (NEPAC) or
CPHC (CPAC) will (should) notify JTWC via telephone
when they open a suspect (invest) area in the Automated
Tropical Cyclone Forecasting (ATCF) system, and provide
the 90-series number, latitude, longitude, and
intensity of the suspect area. TPC/NHC or CPHC is then
responsible for updating the best track of the suspect
area at least twice daily (00Z and 12Z). The respective
agency should be called if the area is not updated at a
minimum of every 12 hours.
-
If JTWC desires to
start a suspect (invest) area, the TDO will notify
TPC/NHC (NEPAC) or CPHC (CPAC) and request that they
open an invest. If the respective agency refuses and
the TDO still believes an invest should be opened, the
TDO should request the next 90-series number and notify
the TPC/NHC or CPHC that they will be opening the
invest. This should also be followed by a call to
JTOPs. JTWC is then responsible for updating the best
track and prompting the NRL and FNMOC TC web pages via
the ATCF system. In the event that the invest develops
and approaches warning criteria it is expected that the
agency responsible for the AOR in question will
eventually assume best track responsibility from JTWC
prior to the first warning/advisory. Since these are
guidelines only, the TDO should verify best track
responsibility with NHC/CPHC for each system. Frequent
communication is crucial.
-
When an area is no
longer suspect for development, the agency responsible
for updating the best track will notify the other
agency that termination of the suspect area is
intended. However, if the agency being notified does
not want the suspect area to be terminated, then that
agency will assume responsibility for updating the best
track. Make an entry in the TDO e-log reflecting the
PHONECON agreement. Frequent communication among
agencies is necessary to avoid confusion regarding
status of an invest or what agency has re-besting
responsibility.
This procedure is adapted from JTWC ESOP
02.
-
Either open the File
menu in the Menu Bar and select Select Map
OR click on Select Map in the Sidebar. The
Choose Area dialog will then be displayed:
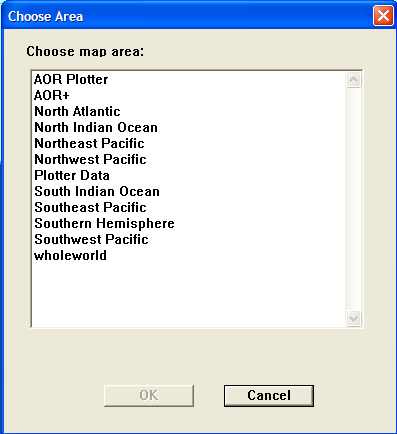
Choose Area Dialog
-
Select the area to be displayed. For
JTWC, the AOR+ area is preferred.
-
Click OK.
-
Either open the File
menu in the Menu Bar and select Select
Storm or click on Select Storm in
the Sidebar. The Choose a Storm dialog will be
displayed:
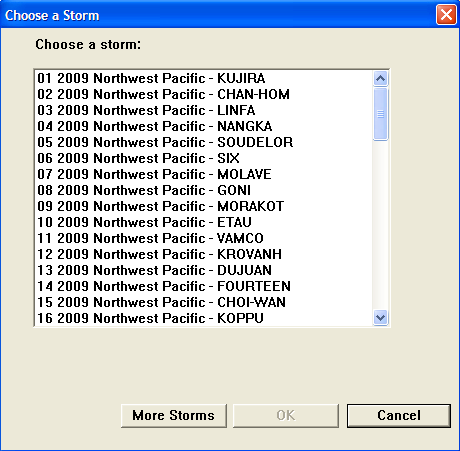
Choose a Storm Dialog
-
Choose a storm from the dialog and click
OK. The storm will then be displayed in
its proper location on the selected map in the map
window.
-
You can zoom in on the storm by either
opening the Tools menu from the Menu Bar
and selecting Zoom In or by clicking
Zoom In in the Sidebar. Using either
method, a yellow prompt in the map window will tell you to
click and drag to select the zoom area. Clicking and
dragging creates a “rubber-band” box on the map
that allows you to select the area to zoom in on. When you
let go of the mouse button, the map will be zoomed to the
selected area. You can undo the zoom by clicking
Zoom Out, or return to the full map
display by clicking Full Map.
This procedure is adapted from JTWC ESOP 02.
There are two different ways to display
imagery in the storm window:
-
Open the Fixes menu
from the menu bar and select View Fix
Data. The View Fix Data dialog that then appears
allows you to select which fix data are displayed and how
they are displayed, and also to select satellite imagery to
overlay on the fix data.
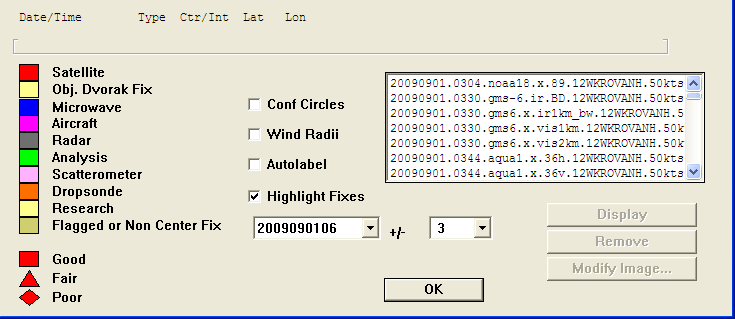
View Fix Data Dialog
You can select the fix(es) to view by
selecting its DTG in the box and selecting the +/- range for
the DTG in the box next to it. You can also select whether to
display Conf Circles and/or Wind
Radii, whether to Autolabel
the fixes, and whether to
Highlight Fixes in the selected time range. In
the selection list on the right side, you can select satellite
and/or microwave imagery to overlay on the fix. It should be
noted that displaying the imagery may take some time, as the
imagery is pulled from NRL.
-
Open the Track menu
from the Menu Bar and select Re-Best. The
Re-Best Track Dialog will appear:
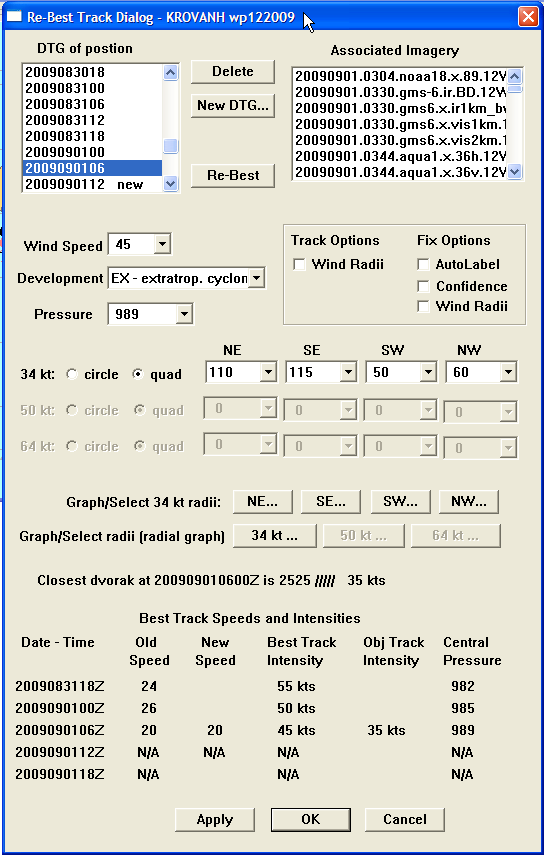
Re-Best Track Dialog
In the DTG of position list
box, select the desired time frame. On the right-hand side the
Associated Imagery list will then contain the
list of imagery applicable to the selected time frame.
Double-click on the desired image and it will appear in the
Storm Window. Click Cancel when done to exit
without changing the best track data.
You can easily remove imagery from the
display by scrolling down in the Sidebar on the left side of
the screen and clicking satellite imagery.
This will remove any imagery currently displayed.
2.6 Entering Microwave Fixes
This procedure is adapted from JTWC ESOP
02.
-
In the Storm Window, open the
Fixes menu in the Menu Bar. Select
Enter Fix Data from the drop-down menu.
The Enter Fixes dialog will be displayed:
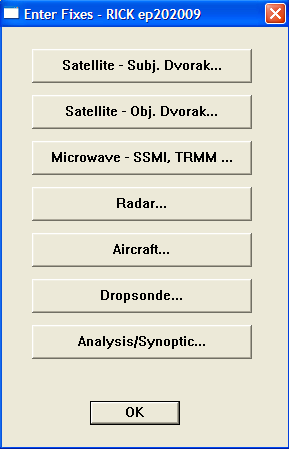
Enter Fixes Dialog
-
Click on Microwave – SSMI,
TRMM…. The Microwave Fix Data dialog will
be displayed:
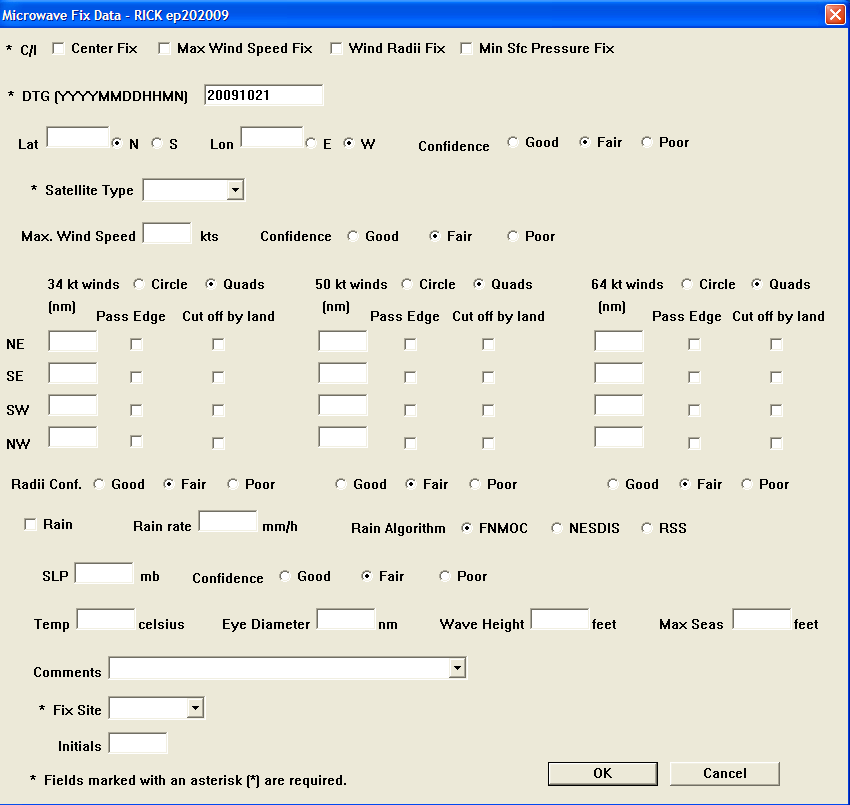
Microwave Fix Data Dialog
-
Select Center Fix in
the top row of check boxes.
-
Enter the DTG
(YYYYMMDDHHMM) in the specified format (e.g.
201007122341) (Note: The year, month, and day initially
populate based on the current Zulu DTG in ATCF.
Double-check to make sure your Zulu date is correct –
this especially applies to fixes entered around or after
00Z).
-
Enter the Latitude and
Longitude of the fix in three digits to
the nearest tenty of a degree — include the
decimal.
-
Ensure the correct hemispheres are
selected next to the Lat and
Lon boxes.
-
Select the Confidence
(PCN) value based on the Poor/Fair/Good decision matrix
below:
|
PCN
|
Confidence
|
|
1 or 2
|
GOOD
|
|
3 or 4
|
FAIR
|
|
5 or 6
|
POOR
|
-
Enter the Satellite
Type based on the satellite type you entered in
“SC-Sensor” on the fix entry worksheet. See
table below for a summary of the different satellite types
and how they would be entered on the worksheet and in
ATCF:
|
Satellite Name
|
Microwave Name
|
Work Sheet
|
ATCF
|
|
DMSP F-12 – F-15
|
SSMI
|
D-S
|
SSMI
|
|
DMSP F-16 – F-17
|
SSMI/S
|
DS-S
|
SSMS
|
|
NOAA
|
AMSU-B
|
N-S
|
AMSU
|
|
TRMM
|
TMI
|
T-S
|
TRMM
|
|
NASA AQUA/TERRA
|
AMSRE
|
A-S
|
AMSR
|
|
CORIOLIS
|
WINDSAT
|
W-S
|
WIND
|
|
NOAA-18 and METOPA
|
AMSU-B
|
MM-S
|
MMHS
|
|
WINDSCAT
|
|
WNDSCT
|
WSCT
|
|
QUICKSCAT
|
|
Q-S
|
QSCT
|
|
ASCAT
|
|
ASCT
|
ASCT
|
-
In the Comments box,
enter any clarifying data (if necessary). Data may include
the sensor frequency used if different frequencies were
available (e.g. 37H, or 85H). If only one frequency is
available leave the Comments box
blank.
-
In the Fix Site list
box, select the correct site (for JTWC, use
PGTW, for KNES, use
KNES).
-
Enter initials (for KNES fixes, no
initials are required).
-
Click OK to complete
the fix entry procedure.
-
Click OK to close the
Enter Fixes dialog.
This procedure is adapted from JTWC ESOP
02.
-
In the Storm Window, open the
Fixes menu from the Menu Bar and select
Enter Fix Data. The Enter Fixes dialog
will be displayed.
-
Click on Satellite – Subj
Dvorak. The Satellite (Subj. Dvorak) Fix Data
dialog will be displayed:
_Fix_Data_dialog.png)
Satellite (Subj. Dvorak) Fix Data Dialog
-
Ensure that Center Fix
is selected for all subjective fixes and Max Wind
Speed Fix is also selected for Dvorak
estimates.
-
Enter the DTG
(YYYYMMDDHHMN) in the specified format (e.g.
201007122341) (Note: The year, month, and day initially
populate based on the current Zulu DTG in ATCF.
Double-check to make sure your Zulu date is correct –
this especially applies to fixes entered around or after
00Z). For KNES fixes be sure to change the N position to a
‘3’ to help distinguish from PGTW fixes.
-
Enter the Latitude and
Longitude. Ensure that the correct
hemispheres are selected.
-
Select the PCN ratio button. Enter the
PCN or CONF by clicking the down-arrow and
selecting 1-6.
-
Enter the Satellite
Type by clicking on the down arrow and selecting
the satellite type, e.g. MTSAT or MET7.
-
Enter the Dvorak Code –
Long Term Trend:
-
Enter the Final
T-Number by clicking on the down arrow and
selecting the desired number. The CI
Number will automatically adjust to the same
number. If the system is weakening, be sure to change
the CI Number.
-
Select the correct radio button in
the Past Change row: Developed,
Steady, or Weakened.
-
Enter the Amount of T-Num
Change by clicking on the down arrow and
selecting the desired number.
-
Enter the Hours since
previous eval (usually 24).
-
Enter the Dvorak Code –
Short Term Trend:
-
Select the correct radio button in
the Past Change row: Developed,
Steady, or Weakened.
-
Enter the Amount of T-Num
Change by clicking on the down arrow and
selecting the desired number.
-
Enter the Hours since
previous eval (usually 6).
-
Change the Fix Type to
LLCC by clicking on the down arrow button
and selecting LLCC from the list.
-
Select the Sensor Type
according to the kind of satellite used (i.e. if you used
VIS select Visual, if you used IR select
Infrared, and if you used Microwave select
Microwave). Note that multiple selections
are allowed (i.e., you can select both
Visual and Infrared if
both were used).
-
Select Tropical,
SubTropical, or
ExtraTropical depending on the type of the
system being fixed on.
-
Add any Comments that
may be necessary (i.e. Wrap amount, etc).
-
For JTWC, select PGTW for the
Fix Site by clicking the down arrow and
selecting PGTW from the list. If entering
KNES fixes manually, select KNES.
-
Enter Initials (not
required for KNES fixes).
-
Click on the OK
button.
-
Click on the OK button
to exit the Enter Fixes dialog.
This procedure is adapted from JTWC ESOP
02.
-
In the Storm Window, open the
Fixes menu from the Menu Bar and select
Enter Fix Data from the drop-down menu.
The Enter Fixes dialog will be displayed.
-
Click on Radar…
and a Radar Fix Data dialog will be displayed:

Radar Fix Data Dialog
-
Click on the Center Fix
checkbox.
-
Enter DTG
(YYYYMMDDHHMN) in the specified format. Note: the
year, month and day initially populate based on the current
Zulu DTG in ATCF. Double check to make sure your Zulu date
is correct – this especially applies to fixes entered
around or after 00Z.
-
Enter the Latitude and
Longitude of the fix. The N/S/E/W will
already be selected for you, but double-check to be
positive that they are correct.
-
Select the correct
Accuracy, Good, Fair, or Poor, in
accordance with the bulletin.
-
Select Radar Fix Type;
in most cases this should be Land.
-
Enter the WMO
Identifier found in the bulletin, e.g. RCWF.
-
In the Enter Fix as
line, select RADOB Code.
-
Click OK. A Radar
– RADOB dialog will pop up, in which you will enter
the RADOB code from the bulletin:
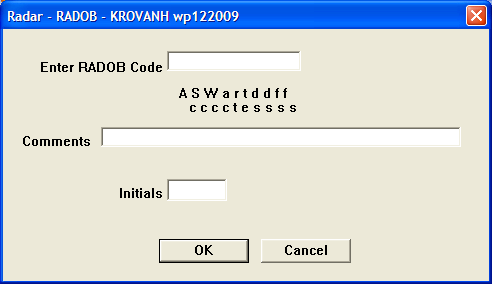
Radar – RADOB Dialog
-
Add any comments (not required).
-
No initials are required for radar
fixes.
-
Click OK.
-
Clilck OK to close the
Enter Fixes dialog.
This procedure is adapted from JTWC ESOP 02.
This procedure should be followed after every fix cycle to
import PGTW and SAB (KNES) fixes.
-
In the Storm Window, open the
Fixes menu and select Import
Fixes from the drop-down menu.
-
A Fix Record Edit dialog will
appear:

Fix Record Edit Dialog
-
Click OK. A window will
appear showing any fixes that have been imported, or none
if there were none available. Close this. Then select
OK on the Fix Record Edit dialog.
This procedure is adapted from JTWC ESOP
02.
-
Either open the Fixes
menu in the Menu Bar and select Fix
Labels, or click on the Fix
Labels item in the Sidebar. Whichever method you
use, a Fix Label dialog will then be displayed. Select the
desired fix and then click Position Label.
A “rubber band” dashed line attached to the fix
will be displayed in the map window. Click and drag the end
of the line to the desired position and release the mouse
button; the label will then be displayed with a line tying
it to the fix position.
 ��
�� 
Placing a Fix Label
-
If the positioning of the label (or any
fix label) is not to your liking, you can delete the label
using the same Fix Label Dialog window by selecting the
desired fix and clicking Delete Label. You
can also delete all fix labels by clicking on fix
labels in the Sidebar.
-
When labeling is complete, click
OK to exit the Fix Label Dialog.
-
You can also label the most recent
microwave and subjective fixes automatically using the
autolabel capability. Open the Fixes menu
from the Menu Bar and select Display
Fixes. In the Display Fixes by Site dialog that
appears, click on the Autolabel check box.
Then click OK. The positioning of labels
by this method is not as appealing as self-made labels,
because they are normally bunched together and therefore
difficult to read.
This procedure is adapted from JTWC ESOP
02.
-
Open the Fixes menu
from the Menu Bar and select Edit Fix Data
from the drop-down menu. The Choose a Fix Data Set dialog
will be displayed.
-
Select the desired storm and click
OK. A Fix Record Edit dialog will open.
Select the desired fix from the list and click Edit
Record. The appropriate data entry dialog for the
selected fix type will be displayed.
-
Change any information that needs to be
changed and click OK.
-
You can also use the Fix Record Edit
dialog to delete a fix record (e.g. in the case of a
duplicate record). Select the record to be deleted and
click Delete Record.
-
Click OK to close the
Fix Record Edit dialog.
This procedure is adapted from JTWC ESOP
02.
At each synoptic hour (00Z, 06Z, 12Z, 18Z)
the on watch Satellite Analyst will update the track for
suspect areas designated as POOR, or invest only.
-
In the Storm Window open the
Track menu from the menu bar and select
Re-Best… from the drop-down menu. A
Re-Best Track dialog will appear:
Re-Best Track Dialog
-
Click Re-Best. When
this is selected, control returns to the Storm Window where
you are prompted to click the new position on the map, or
off the map to cancel. Designate the best position, based
on available fix data and imagery. To choose the current
position be sure to utilize ALL available data, including
fixes, satellite and microwave imagery, QSCAT/ASCAT, and
RADAR. Once a desired location is found, choose the
position by single-clicking.
-
Click Apply.
-
Click OK.
-
After you click OK, a
Confirmation dialog will pop up asking whether you want to
update the position on the TC Web Page. Click
Yes. The window will then close.
This procedure is adapted from JTWC ESOP
02.
After re-besting a ‘POOR’ or
‘Invest Only’, the Satellite Analyst must import
the Objective Aids.
-
In the Storm Window, open the
Aids menu from the Menu Bar and select
Import New Objective Aid Data.
-
After importing the aid data, open the
Aids menu again and select Create
Objective Aids Forecasts, then select Run
Objective Aids (4 min) from the flyout menu.
-
After a few moments a window will appear
showing the objective aids. Close this window.
-
Open the Aids menu
again and select Display Objective Aids to
display the newly imported objective aids. See Section
3.5.A, Error: Reference source not foundfor more
information on this feature.Error: Reference source not
found
This procedure is adapted from JTWC ESOP
02.
To deactivate a storm from the NRL/FNMOC TC
websites:
-
In the Storm Window, open the
File menu from the Menu Bar and select
Communicate With Other Site.
-
In the flyout menu, select
Deactivate Storm on NRL/FNMOC TC Page.
-
Select .
-
Select Yes.
This procedure is adapted from JTWC ESOP
02.
To delete a storm:
-
Open the Manage-Storms
menu from the Menu Bar.
-
Select Delete a
Storm… from the drop-down menu. The Delete
a Storm dialog will be displayed:
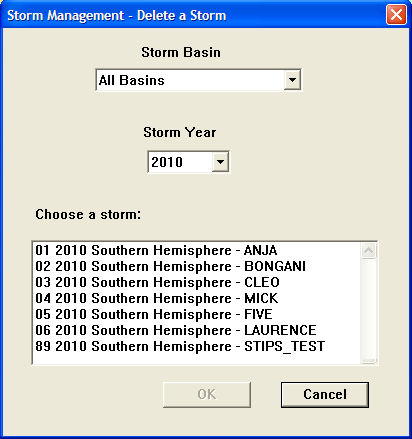
Delete a Storm Dialog
-
Choose a storm from the list, and click
OK.
-
Click OK to
confirm.
This procedure is adapted from JTWC ESOP
02.
-
In the Storm Window, open the
Fixes menu from the Menu Bar and select
Fixes Editor from the drop-down menu. The
Fixes Editor window will be displayed:
Fixes Editor Window
-
In the Menu Bar of the Fixes Editor
Window, open the File menu and select
Save from the drop-down menu.
This procedure is adapted from JTWC ESOP
02.
-
In the Storm Window, open the
File menu and select Save
Graphic. The ‘Select or enter the graphic
filename’ dialog will open:
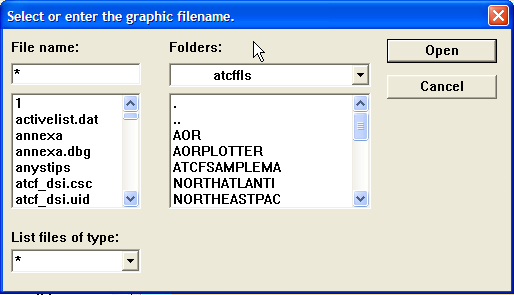
Select or enter the graphic filename dialog
-
Enter the file name and location (each
organization has its own conventions for these) and click
Open to save the file.
This procedure is adapted from JTWC TDO SOP
08.
The “working best track” is a
best fit of position, intensity, and wind radii based on all
fixes, imagery, and synoptic data available. The active storm
track is continuously adjusted and smoothed as new information
becomes available. Reanalysis of recent storm positions based
on reliable new data provides a more representative storm track
direction and speed vector and better estimates of storm
intensity. The track direction and speed vector is critical to
the proper utilization of numerical aids that use the past
twelve to twenty-four hours of motion as the persistence input
to their analyses. An accurate intensity trend is essential to
proper initialization of the ST11 statistical intensity
guidance. JTWC Policy is discussed in TDO SOP 08; what follows
here deals with the procedures related to ATCF for real-time
best tracking.
-
Before updating the best track for an
active system, confirm with the Satellite Analyst that all
available fixes have been entered into ATCF. This includes
satellite, synoptic, microwave, radar, and QUICKSCAT
data.
-
Enter the best track data:
-
From the map display window for an
active system, open the Track menu and
select Re-Best from the drop-down
menu. The Re-Best Track Dialog will open:
Re-Best Track Dialog
-
In the Re-Best Track Dialog, click
on the Re-Best button. Selecting this
feature returns functional control to the map display
window, where the TDO is prompted to designate the best
position based on available fix data and imagery. Use
all available data to choose the current position by
clicking on the map display at the desired location.
You can view imagery as an overlay to assist in this
process by double-clicking the filename of the desired
image in the Associated Imagery list
box in the Re-Best Track Dialog. You can also call up
imagery associated with prior best track positions by
first selecting the desired best track time from the
DTG of Position list.
-
After the new position is designated
in the Map Display, control returns to the Re-Best
Track Dialog, where the TDO sets the maximum sustained
Wind Speed,
Development level (this typically
updates automatically based on wind speed, but
double-check that it is correct), and wind radii as
appropriate based on available fixes and other data.
Note: Select the best estimate intensity even for
invest areas – the current intensity trend has a
significant effect on the calculation of ST11
statistical intensity guidance.
-
Continually adjust. Along with setting
the current position, the TDO should continually adjust
previous track positions, intensity, and wind radii to
ensure values of these parameters are as accurate as
possible. Below are some tools available to assist in this
effort:
-
List Working Best
Track. From the Storm Window, open the
Track menu and select List
Working Best Track. A list of historical best
track positions, intensities, and wind radii for the
current system of interest will appear. Focus on track
speed and intensity trends – ensure that large
jumps in speed or changes in intensity from one period
to another can be justified by the available data.
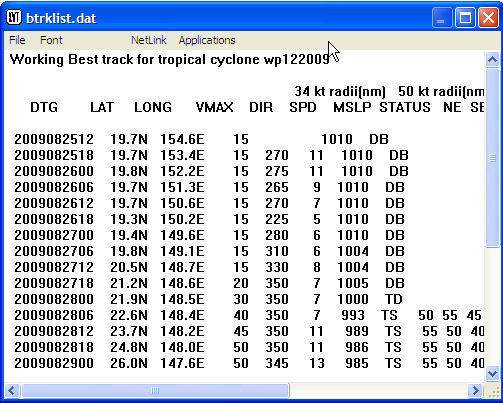
List Working Best Track Display
-
Graph Fix Intensity vs Time:
From the Storm Window, open the Track
menu and select Graph Fix Intensity vs
Time. A graph of intensities associated with
all available fixes will appear (CI for Dvorak fixes),
along with a red line showing best track intensities.
Viewing this graph can help the TDO spot potentially
misrepresentative trends in the data.

Graph Window Showing Fix Intensity vs Time
-
Running Objective Aids: After selecting
the best track position and updating associated parameters,
the TDO must import and run objective aids. Running aids
spurs production of the BAM and WBAR model trackers,
initiates the active area on the CIRA RAMMB TC page
(
http://rammb.cira.colostate.edu/products/tc%5FRealtime/)
and the CIMSS AMSU temperature sounding page (http://amsu.ssec.wisc.edu/),
etc. From the Storm Window, open the Aids
menu and select Import New Objective Aid
Data. Once this process is complete, open the
Aids menu again and select Create
Obj Aid Forecasts. In the flyout menu that
appears, select Run Objective Aids. A text
window will appear when the process is complete, showing
what aids were run. Close this window.
-
Using the Objective Best Track Function:
ATCF can automatically analyze a best fit track based on
available unflagged fixes. The objective best track (OBT)
routine hedges its position estimates based on position fix
confidence as determined and set by the person entering the
fix (typically the Satellite Analyst). The OBT can help the
TDO to identify areas where the working best track differs
significantly from an objective, mathematically-based fit
to available fix data. However, the most accurate working
best track solution will usually deviate from the OBT track
since some fixes and imagery provide clear-cut
presentations of the actual storm position.
-
To create the objective best track,
start by opening the Track menu from
the Storm Window, selecting Objective Best
Track from the drop-down menu, and selecting
Make Objective Best Track from the
flyout menu that appears. The OBT will appear in the
Storm Window, and a text window will be displayed
providing notification of the fixes used to create the
OBT. Note: Fixes must be displayed on the map
display in order for the Make
Objective Best Track function to
run.
-
Flagging fixes: In order to remove
fixes from consideration by the watch and the OBT
routine, the TDO should flag errant fixes. Fixes are
typically considered errant, and thus worthy of
flagging, when a high-confidence working best track
lies outside the fix confidence circle. From the Storm
Window, open the Fixes menu and select
Flag Fixes…. Control shifts to
the Map Display window, where you can click on the fix
you would like to flag. A Flag Fixes dialog will also
appear to allow you to enter the reason(s) for flagging
the fix.
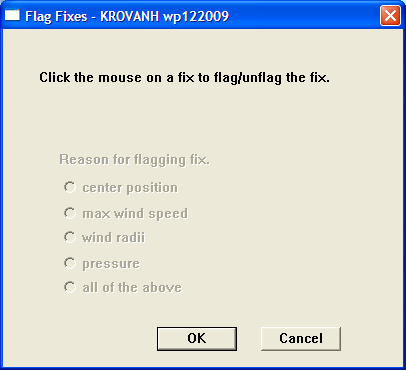
Flag Fixes Dialog
-
Log Maintenance: Certain comments
regarding working best track efforts should be added to the
ATCF storm log. To access the ATCF log from the current
system’s Storm Window, open the
Track menu from the Menu Bar and select
Log Comments…. Note: The ATCF
log can also be accessed through the
Fixes and
Aids menus.
TDOs should always log the fixes
they’ve flagged, including the reason for flagging. The
on-watch TDO is also encouraged to log very high confidence
best track position and intensity confidence and the basis for
such high confidence. Doing so will send a strong signal to
following TDOs and the post-storm best track officer that a
position/intensity should be maintained unless solid evidence
to refute the position/intensity is available. After you have
entered input into the ATCF log, save the file by clicking on
the disk icon or by selecting File and
Save from the menu bar.
To ensure that the ATCF data files do not
become corrupted and unusable, the TDO should perform periodic
checks of these files.
-
Check Fix Data: From the Storm
Window, open the Fixes menu and select
Check Fix Data…. A
text window will be displayed showing the results:
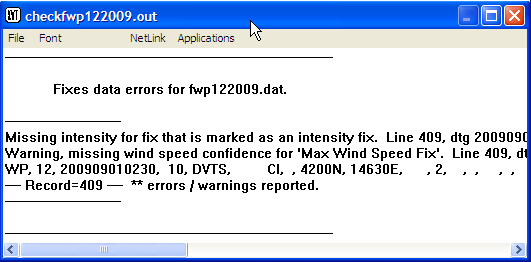
Check Fix Data Output
If any errors are found with manual fixes
(i.e. problems with CIMSS and CIRA automated fixes note included)
notify the SATOPS QC coordinator for correction.
-
Check Best Track Data: From the
Storm Window, open the Track menu in the
Menu Bar and select Check Best Track
Data…. A text window will be displayed
showing the results. If any errors are found, notify
JTOPS.
-
Check Objective Aid Data: From
the Storm Window, open the Aids menu from
the Menu Bar and select Check Objective Aid
Data…. A text window will be displayed
showing the results:
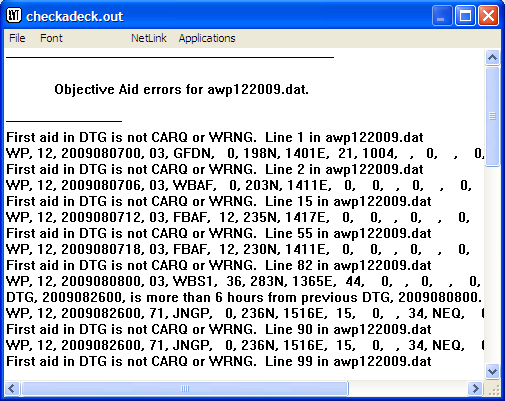
Check Objective Aids Data Results
If any errors are found, notify Techniques
Development for resolution. However, the following error type,
if found, can be disregarded:
First Aid in DTG is not CARQ or WRNG. Line 1
in awp092005.dat
WP, 09, 2005073000, 71, JNGP, 0, 74N, 1378E,
15, 0, 34, NEQ, 0, 0, 0,
This section provides instructions, based on
JTWC SOP 11, on creating and submitting synthetic observations
(bogus) to numerical model guidance.
Certain numerical models do not resolve
tropical cyclones adequately and require synthetic observations
in order to generate a vortex tracker. These synthetic
observations are made available to the models through the bogus
process. One of the “bogused” model trackers, GFDN,
will not be available for use in the forecast process unless
the TDO prepares and submits a bogus. This section shows how to
create and transmit a bogus using ATCF, and follow up
afterward.
-
To start the process of creating a
bogus, open the Track menu from the Menu
Bar of the Storm Window, click on Bogus,
and select Create the TC Bogus…
from the flyout menu as shown below:
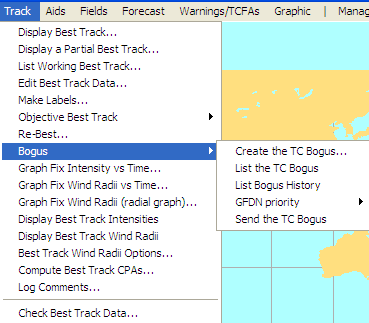
Selecting Create the TC Bogus
-
The Prepare Compute Data dialog box will
then be displayed:
Prepare Compute Data Dialog
There are 15 fields
in the bogus process:
-
In the
Date-Time-Group box, enter the
date-time-group associated with the most recent
synoptic best track time (ending in 00, 06,12, or 18).
This field takes the form of YYYYMMDDHH, e.g.
2010032606.
-
The Lat column of
the position list, in the Current
line, should now show the latitude of the selected best
track position. This typically requires no adjustment,
but should be checked, as should the hemisphere radio
button.
-
The Lon column of
the position list, in the Current
line, should now show the longitude of the selected
best track position. This typically requires no
adjustment, but should be checked, as should the
hemisphere radio button.
-
The box in the Max Wind
(kt) column in the Current
row should show the intensity chosen in the best track
position dialog. Check for accuracy.
-
The box in the Dir
(deg) column in the Current
row should show the vector direction between the
previous best track position and the current
position.
-
The Spd (kt) column
in the Current row should show the
speed (vector magnitude) between the previous and
current best track positions.
-
The Eye Diameter
box should be set when there is an eye present in
satellite imagery; if no eye is present, set this value
to 0.
-
The Max Wind Radius
entry should be set to the radius of maximum winds; use
the drop-down to select the radius.
-
In the Vertical Extent of
Circulation box, click the down arrow and
select the vertical development (shallow, medium, or
deep) for the current storm. This is also used as a
proxy for the steering level of the system. Fully
developed systems will typically be deep (>400
mb).
-
In the Central
Pressure box, click the down arrow and select
the central pressure of the system. This is suggested
by the Max Winds chosen using a wind-pressure
relationship.
-
In the Outermost Closed
Isobar box, select the pressure associated
with the horizontal extent of the circulation, beyond
which the effects of the barotropic flow should not be
felt.
-
In the Radius Outermost
Closed Isobar box, enter the horizontal
distance from the center to the Outermost Closed Isobar
above.
-
In the 34 KT winds,
50 KT winds, and 64 KT
winds rows, enter the extent in each quadrant
(NE, SE, NW, SW) of the relevant winds.
-
Set the Bogus Priority. After filling
out the Prepare Compute Data dialog and clicking its
OK button to create the bogus itself, you
need to set the bogus priority. Open the
Track menu, select Bogus,
and select GFDN priority from the flyout
menu. Another flyout menu will allow you to select the
priority. Priority is based on the current storm’s
“operational precedence.” For example,
designate storms threatening assets with a higher priority.
No two invest/storm boguses may share the same priority.
The GFDN model will ingest higher priority bogus data first
and, in the event of a computer problem or an unusually
busy multi-storm and invest situation, will only be able to
accept the highest priority boguses.
-
Send the bogus. After the steps above
are complete, open the Track menu, select
Bogus, and select Send the TC
Bogus… from the flyout menu. This will send
the bogus information to FNMOC for ingestion into the
NOGAPS and GFDN models and for further distribution to
other agencies that use the data.
-
Follow up on submission of the bogus. A
few hours after the bogus has been submitted, expect to
receive a GFDN Bogus Confirmation in the TDO inbox. This
message confirms arrival of the bogus at FNMOC. However
this message does not indicate whether the bogus
information reached other agencies. To locate the GFDN
tracker generated as a result of bogus submission, logon to
the FNMOC BFT server and search for “GFDN.”
This section provides instructions, adapted
from JTWC SOP 12, for using ATCF to prepare and post the 5-day
objective aids graphic. JTWC creates 5-day aids graphics for
FAIR areas or better and posts them to NIPRNET, SIPRNET, and
PZAL. To create the 5-day objective aids graphic:
-
Open the appropriate storm window and
display geography labels with dots (in the Sidebar, select
geo. Labels – dots).
-
Display objective aids representative of
the current guidance (open the Aids menu
from the Menu Bar and select Display Objective
Aids……, then select
the DTG and profile from the Objective Aids dialog). For
JTWC, this generally means the standard suite of aids that
make up the CONW profile. Only use BAMs for the first
couple of warnings or if no dynamic aids are available.
-
Prepare the aids graphic for posting to
the web. Open the Aids menu from the Menu
Bar and select Import New Objective Aid
Data. Then open the Aids menu
again and select Create Objective Aid
Forecasts and Run Objective Aids (4
min) from the flyout menu. Finally, open the
Aids menu again and select Display
Objective Aids… and select the aids to
display from the Objective Aids dialog. The figure below
shows what the 5-Day Objective Aids graphic should look
like:
5-Day Objective Aids Graphic
-
Open the File menu in
the Menu Bar and select Save Graphic. This
opens the “Select or enter the graphic
filename” dialog:
Select or enter the graphic filename Dialog
-
Use JAMS (back-up is the ‘5-Day
Aids Upload Tool’) to post 5-Day Objective Aids
graphic to the NIPRNET and SIPRNET 5-Day Aids websites, as
well as to PZAL.
This section is adapted from JTWC SOP 14 and
deals with the use of ATCF for issuing a TCFA, displaying the
TCFA area, creating and sending the TCFA message, and creating
the TCFA graphic.
The TDO produces and distributes a message
detailing the location and meteorological reasoning for all
TCFAs. The TCFA valid period is 24 hours. A TCFA never expires,
but is cancelled, reissued, or superseded by the first warning
based on the disturbance.
-
Issuing a TCFA: When a TCFA is
warranted, the TDO must decide whether the forecast area
will be a circle or a box. This is based on the speed of
the system and the size of the objective aids envelope. For
example, a circular area is appropriate if systems are
moving slowly within weak steering flow. For systems moving
faster, a rectangular area would be more appropriate. The
length of the box should be determined by the forecast
speed and the 24 hour objective aids forecasts. The width
of the box should be determined by the TDO’s
confidence in the objective aids, taking into account the
spread over 24 hours.
-
Make the TCFA area: (Note: You must
have an Invest area started before beginning this
process; see Section 2.2 Starting a Storm for details.
Use select storm in the Sidebar to
select the invest area for the TCFA). Open the
Warnings/TCFAs menu from the Menu Bar
and hover the cursor over Make TCFA
Area -- a flyout menu will present the option
of a circular
(Circle) or
rectangular (Box) area.
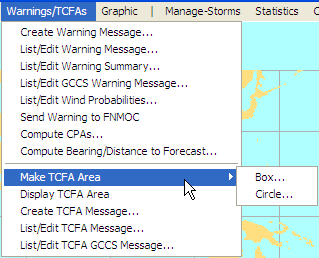
Selecting the TCFA Area Type
-
For a rectangular area: Select
Box…. This will open the TCFA
Box Creation dialog shown below. Use the slider at the
bottom to set the distance from the center line to the
edge of the box. Then click on the map, where a prompt
will direct you to click and drag the mouse to
designate the center line of the box. When you release
the mouse, the information at the top of the dialog
will be filled in. Click the OK button
to close the dialog. Proceed to step 2 below.
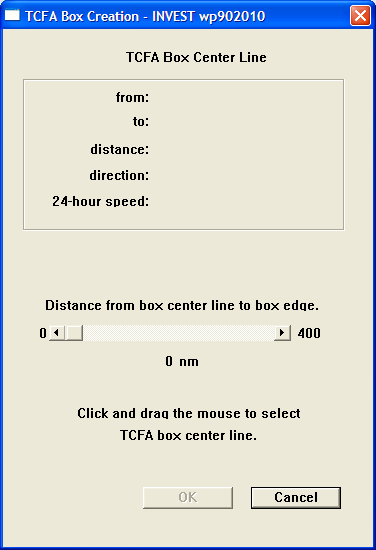
TCFA Box Creation Dialog
-
For a circular area: Select
Circle… and the TCFA Circle
Creation dialog shown below will be displayed. In the
dialog, set the radius of the circle, and then click on
the map to establish the center point. The information
at the top of the dialog will then be filled in. Click
the OK button to exit the dialog.
TCFA Circle Creation Dialog
-
Displaying the TCFA area: The TCFA area
should now be displayed on the map. If for any reason it
isn’t, you can re-display it by opening the Storm
Window for the invest area and selecting Display
TCFA Area from the Warnings/TCFAs
menu.
-
Create the TCFA Message: With the TCFA
warning area displayed, open the
Warnings/TCFAs menu from the Menu Bar and
select Create TCFA Message…. The
Create a TCFA Message dialog will be displayed as shown
below.
Create a TCFA Message Dialog
Enter the following:
-
For WT number
ensure the lowest unused number is entered.
-
MANOP DTG to the
nearest ½ hour.
-
Message
DTG: MANOP DTG – 9
minutes.
-
Estimated Winds:
Ensure you don’t make winds too high (e.g. 20 to
25 knots would merit a warning vice a TCFA; typically
winds for a TCFA are 15-20 knots in WESTPAC and 25-30
knots elsewhere.)
-
Location method(s)
: Check one or more of the methods and then enter the
DTG of most recent location data as
specified.
-
Circulation Center
Source: Indicate how the circulation center
was determined.
-
Storm System
Direction: Choose the appropriate value from
the drop-down list.
-
Storm System Speed:
Enter the appropriate value.
-
Alert valid until:
MANOP DTG + 24 hours.
-
Remarks…:
Enter any remarks needed (see SOP 15 for further
guidance).
-
Signature
Line…: Enter the TDO’s
signature.
-
Create the TCFA Graphic. Begin by
zooming in on the TCFA area. Include geography if available
(select geo. Labels – dots in the
Sidebar).
-
Create the TCFA Label: Open the
Graphic menu and select Create
TCFA Label. A text box will appear allowing
you to enter the label, which will then appear on the
map window as shown below. Ensure you check the MANOP
DTG since ATCF will default to the nearest hour, and
change manually if needed. Use the
Position button to position the label
by dragging it in the map window. Click the
Done button when the label is correct
and correctly positioned.
Creating the TCFA Label
-
Mark the circulation with a
“C”. Open the Graphic menu
from the Menu Bar and select Chart and Storm
Titles…. This will open the Storm
Title/Chart Title Dialog shown below. In the
Enter Text box, enter a C as shown in
the example.
Storm Title/Chart Title Dialog
Click on the Font
Selection… button and select the desired font
from the Font Selection dialog:
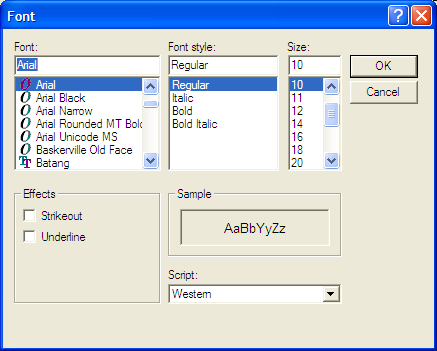
Font Selection Dialog
Select the desired
font and size (suggest Nimbus font, 45-50 point) and click the
OK button to return to the Font Selection
dialog. Then click on the Color… button
to display the Text Color Dialog:
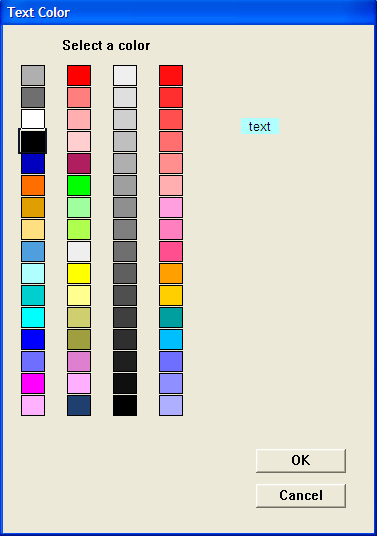
Text Color Dialog
Select a red color and
click on OK to return to the Storm Title/Chart
Title dialog. Click on the Position Text
button and the focus will shift to the Storm Window, where you
will be prompted to click at the lower left corner of the place
you want to put the “C”. Doing so will display the
“C” and return you to the Storm Title/Chart Title dialog,
where you can click on the OK button to exit.
The completed TCFA graphic should look something like this:
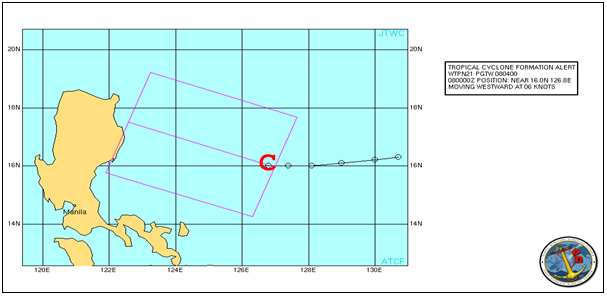
Completed TCFA Graphic
-
Send the graphic: Open the
File menu from the Menu Bar and select
Communicate With Other Site, then
Send Warning/Graphic to Homepage, JMV, NRL,
FNMOC from the flyout menu.
No additional steps are necessary when
re-issuing a TCFA. The graphic is updated and a new MANOP is
required in the graphic’s text box. A TCFA will be
re-issued if:
-
The circulation center moves outside the
TCFA box or circle before a warning is issued or the TCFA
expires, or
-
The TCFA is due to expire and the
circulation center still has good potential to develop into
a tropical cyclone.
Writing Canceled across the graphic (see
example below) is required when a TCFA is cancelled. JTWC SOP
15 should be consulted for the text requirements for cancelling
a TCFA at JTWC.
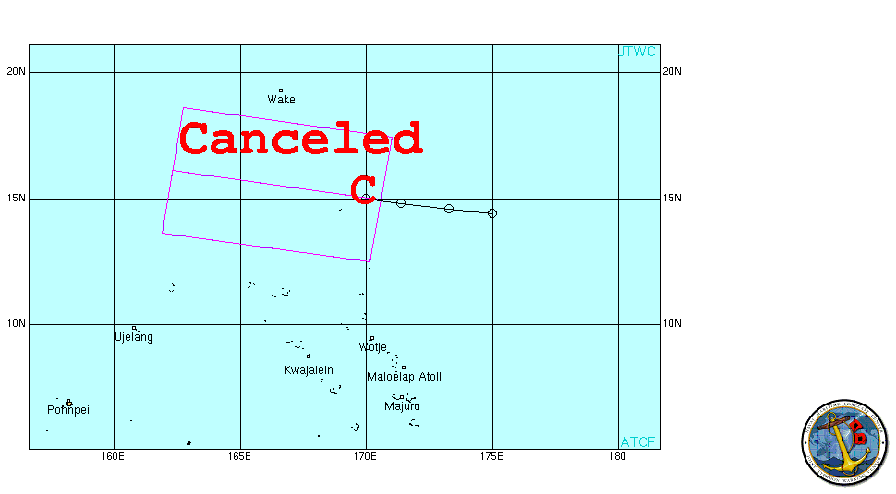
Cancelled TCFA Graphic
A TCFA is cancelled once the tropical
disturbance no longer poses the threat of becoming a
significant tropical cyclone. Do not cancel a TCFA within its
24 hour valid period unless it can be downgraded to a
“POOR” on the appropriate significant tropical
weather advisory bulletin. Ensure ATCF is used to generate the
cancellation message.
-
When cancelling a TCFA, a cancelled TCFA
graphic will need to be communicated/sent to the TC web
pages. If you do not have the original TCFA graphic opened
in ATCF, you will need to recreate the graphic
BEFORE canceling the TCFA in ATCF
(see section D.1. above for details on creating the TCFA
graphic). If you fail to do so, you will not be able to
display the TCFA box and label once the TCFA is canceled in
ATCF.
-
The TCFA cancellation function is within
the “Create TCFA Message” function of ATCF.
With the TCFA displayed in the Storm Window, open the
Warnings/TCFAs menu and select
Create TCFA Message…. A small
dialog will pop up telling you that the storm is already in
TCFA state. Click Continue to proceed. The
next dialog asks you whether the TCFA is to be corrected,
cancelled, or re-issued. Click Cancelled.
You will be returned to the Create a TCFA Message dialog
– follow the procedures for your location regarding
the guidance for cancelling a TCFA (at JTWC, see SOP
15).
This section discusses the use of ATCF to
aid the forecasting process and is adapted in part from JTWC
SOP 18 and an older ATCF System User’s Guide.
The forecast process is a necessary
precursor to the development of warnings and the warning and
ship avoidance graphics. The basic steps are 1) Forecast Track,
2) Forecast Intensity, and 3) Forecast Wind Radii. Each of
these is discussed in a separate section below.
-
To begin forecasting a storm track, with
the Storm Window open, open the Track menu
and select Forecast Track.... This opens
the Forecast Track dialog, shown below:
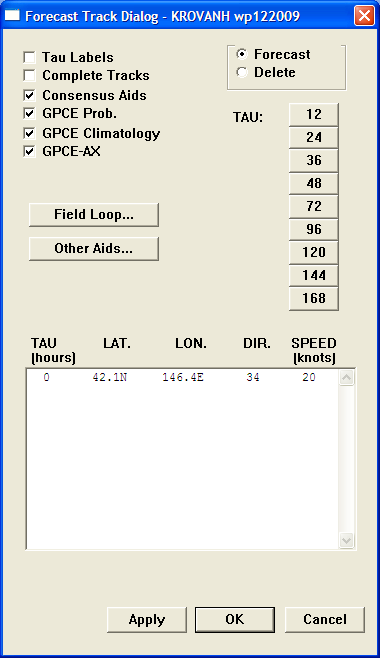
Forecast Track Dialog
If the currently
available objective aids are not displayed in the Storm Window,
aids may be manually selected by utilizing the Other
Aids… button in the dialog. This
Objective Aids Dialog
opens the Objective
Aids dialog which can be used to select the aids to display.
The flow in this dialog seems to work best if done in this
order:
-
Select the DTG in the Select
DTG(s) list box.
-
Select the profile in the
Select profile list box. For JTWC,
CONW is usually used. Aids associated with the profile
should be highlighted in the Select Objective
Aids list box. If other aids are desired, hold
down the Ctrl key while clicking on each additional aid
desired.
-
Click the desired tau button. The
selected aids will then be displayed in the Storm
Window. You can use the check boxes at the bottom,
together with the Apply button, to
toggle on or off various additional features in the
display.
-
Click OK when the
desired aids are displayed. This will return you to the
Forecast Track dialog.
-
In the Forecast Track dialog, with
objective aids displayed, select the next available TAU
(forecast time); when beginning a forecast this would be
12. The Storm Window will then show the
objective aids truncated to the 12 hour forecast time
period. By default, the display will show both the aid
designator (e.g. NGPI, WBAI, etc) and the forecast tau
selected; you can turn off the tau labels for clarity
(since all of the aid positions are for the same tau) by
toggling the Tau labels selection in the
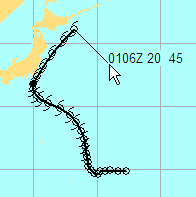
dialog. The figure below shows the display for tau 12 with
tau labels turned off:
Track Forecasting Display for Tau 12, Tau labels
Off
The circles
displayed around the TAU 12 positions are the Goerss
Probability Consensus Error (GPCE Probability) circle,
displaying the 70% confidence circle. The example shows both
the GPCE Probability circle and the GPCE-AX (GPCE Along and
Cross Track) ellipse (GPCE-AX gives separate radii for
along-track and cross-track probabilities). The GPCE
probability indicates that there is a 70% probability that the
observed best track will fall within that circle at the given
TAU. You can toggle the GPCE circles on and off using the
GPCE Prob., GPCE Climatology,
and GPCE-AXcheckboxes. Based on the forecast
reasoning and the overall synoptics, click on the map to select
the forecast position. The forecast position chosen (latitude
and longitude), forecast direction of movement, and forecast
speed of movement will populate for each forecast TAU as its
location is placed on the map.
-
Repeat the above process for the
remaining required TAUs (note that the different basins
have different forecast length requirements and
guidelines).The final forecast track will look similar to
the graphic below.
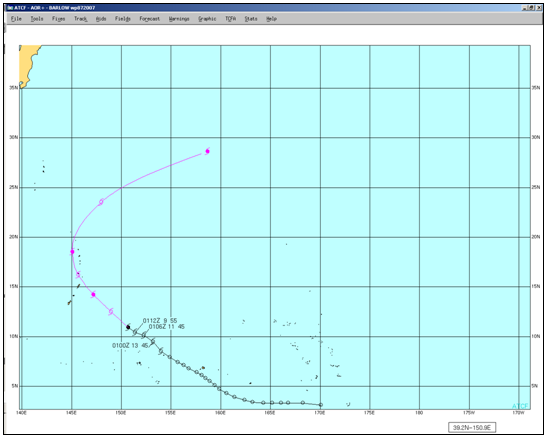
Example of Final Forecast Track
To forecast storm intensity in ATCF:
-
In the Storm Window, with the storm to
be forecasted selected, open the Forecast
menu and select Forecast
Intensity…. This will open the Intensity
Forecast dialog. This dialog is relatively simple to use,
with drop-down menus for the intensity. You don’t
need to change the gusts; these are set and are based on
the maximum sustained wind. The available intensity
guidance from the aids is displayed for your
consideration.
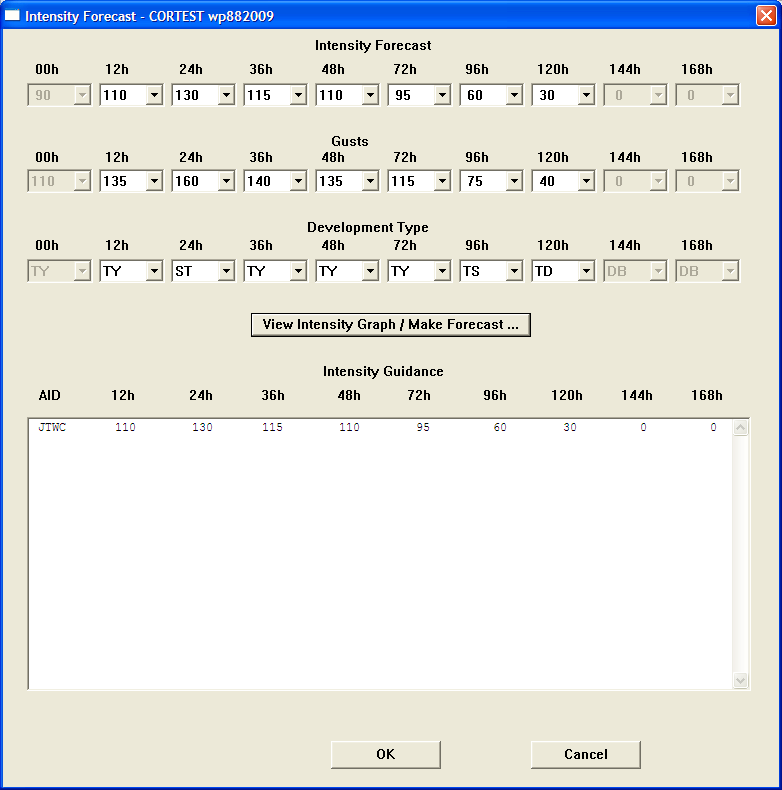
Intensity Forecast Dialog
If you click on the
View Intensity Graph / Make Forecast button,
you will be able to select and graph intensity aids as desired.
You will be presented with an Objective Aids Time Intensity
dialog to allow you to choose the aids to be included in the
graph:
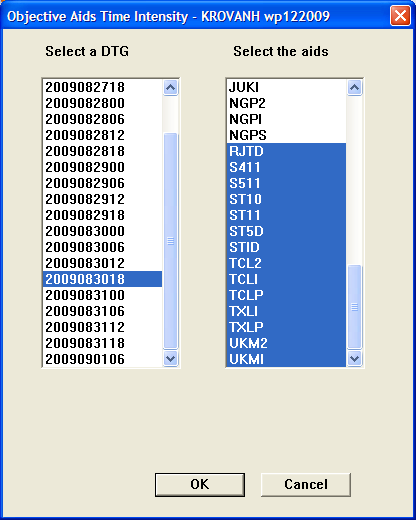
Objective Aids Time Intensity Dialog
And the results will be displayed graphically:
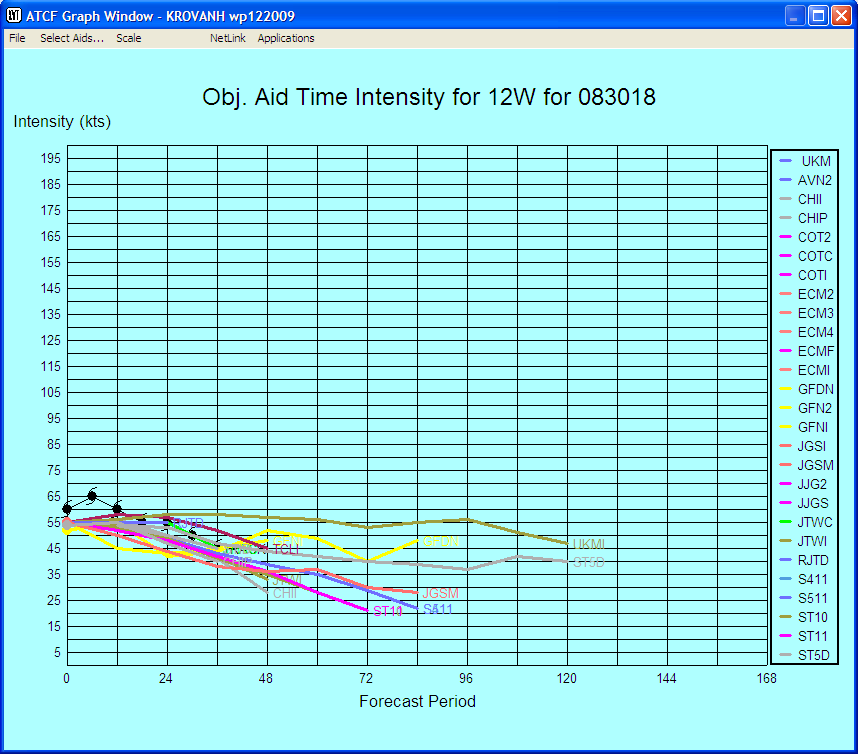
Objective Aid Time Intensity Graph
This graph is
interactive – you can click on the graph to select the
intensity for a forecast period.
To use ATCF for forecasting wind radii:
-
In the Storm Window with the storm to be
forecasted selected, open the Forecast
menu from the Menu Bar and select Forecast Wind
Radii…. The Forecast Wind Radii dialog will
be displayed. The text box at the bottom shows the current
forecast. The one above it presents available guidance,
such as the DeMaria Radii CLIPER (DRCL) radii. You can use
the buttons and pull-down boxes at the top to select the
TAU, and for each of the radii specify
whether the forecast is by complete circle or quadrant, and
select the radii. The Display Options
button lets you choose what will be displayed in the Storm
Window. The Use DRCL – Current TAU
button allows you to view the DRCL radii for guidance. The
Use Previous TAU button populates the
current TAU with the values from the previous TAU (e.g.
repeat the TAU 24 values as the TAU 36 forecast). The
Delete Radii button clears the values from
the current TAU.
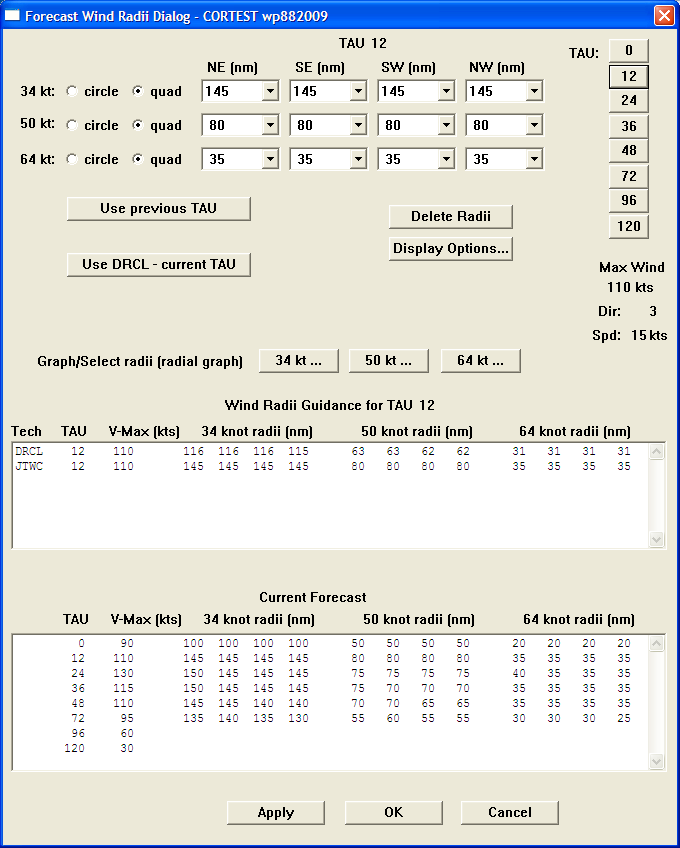
Forecast Wind Radii Dialog
-
You can also use the
Graph/Select radii (radial graph) button
for the appropriate TAU to view guidance and select wind
radii graphically. Each of the buttons opens an interactive
graph window like the one shown below. The arrow in the
window shows the storm’s current direction and speed
of movement. The dots show the forecast guidance (in the
example, the DRCL radii). You can click in any quadrant to
select the wind radius in that quadrant. The Menu Bar at
the top contains selections for the quadrant, TAU, and
radius being forecasted, and for the scale of the display.
When you’ve completed your selections, open the
File menu and select
Exit. Your selections will then be
displayed in the Forecast Wind Radius Dialog. Click on the
OK button to exit.
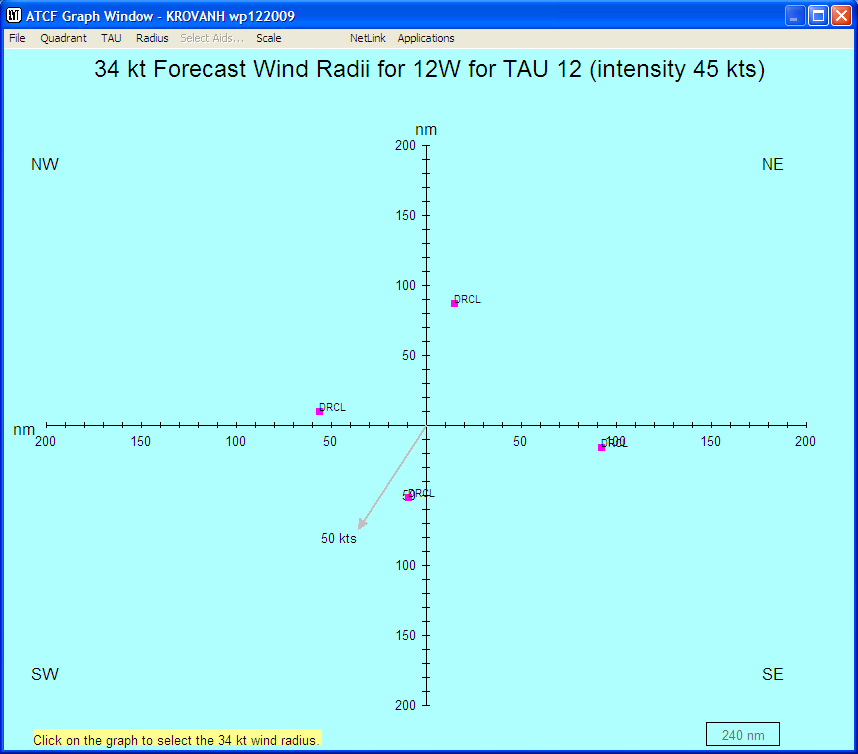
Graph/Select Wind Radii Display
Another function in the
Forecast menu computes the Ship
Avoidance Area. This is based on the 5-year running
mean of forecast position errors for tropical cyclones in the
basin. Selecting this option opens a dialog allowing you to
select the period for which the Ship Avoidance Area will be
computed – the default of 000-024 is generally used.
Click OK to display the area:
Ship Avoidance Area (dashed outline)
The Error Swath function,
selectable from the Forecast menu, produces a
hatched area similar to the Ship Avoidance Area. It is also
based on the 5-year running mean of forecast position errors
for tropical cyclones in the basin.
This section deals with the use of ATCF in
producing warnings and warning graphics, and is adapted from
JTWC SOP 18 and the ATCF System User’s Guide (Version
4.4.2).
The primary ATCF functions used in creating
warnings and warning graphics are Create Warning
Message, Compute CPAs, and
Compute Bearing/Distance to Forecast in the
Warnings/TCFAs menu, and Create Warning
Graphic in the Graphic menu. Follow the following
steps to generate a warning and the related warning
graphic.
-
Create the Warning Message. With
the storm to be warned on selected and displayed in the
Storm Window, open the Warnings/TCFAs menu
in the Menu Bar and select Create Warning
Message…. This will display the Create a
Warning Message dialog:
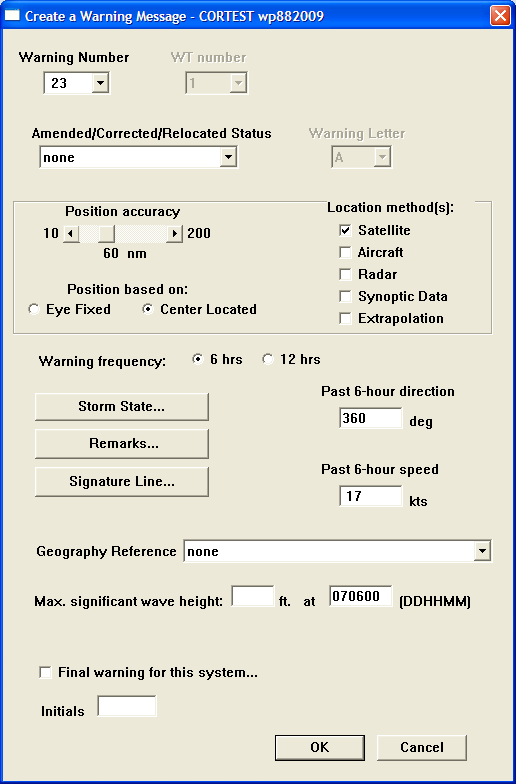
Create a Warning Message Dialog
-
Verify the correct number in the
Warning Number box.
-
Select
Amended/Corrected/Relocated Status as
appropriate from the drop-down list.
-
Position Accuracy
should be obtained from the Satellite Analyst.
-
Select the appropriate option for
Position based on. Note that Eye Fixed
does not include a banding eye.
-
Under Location
method(s) select the appropriate check boxes
to indicate additional data used to obtain the
position.
-
Warning Frequency
is set at 6 hours by default; you will need to change
this if you go to 12-hourly warnings.
-
Click on the Storm
State… button to display the Storm
State dialog:
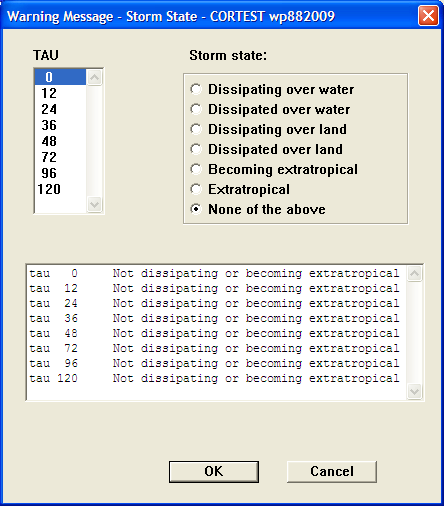
Storm State Dialog
Select the appropriate
TAU and Storm state.
The results are shown in the text box at the bottom.
Click OK to close the dialog and
proceed.
-
Past 6-hour
direction and Past 6-hour
speed should already be filled in from the
position information. Check to ensure that they are
correct.
-
Remarks…
opens a text entry box in which you can insert any
pertinent remarks.
-
Signature opens a
dialog in which you can enter your site-specific
signature.
-
Geography Reference
allows you to select from a list that shows the
storm’s current proximity to various geographic
landmarks.
-
Max significant wave
height should be obtained from the FDO, Winds
and Waves Forecaster (will need current intensity,
motion, and previous wave height used).
-
Check the Final warning for
this system… checkbox only if you are
issuing the final warning.
-
In the Initials
entry box, enter the TDO’s initials.
-
Click OK to close
the dialog.
-
Compute CPAs. Begin by opening
the Warnings/TCFAs menu from the Menu Bar
and selecting Compute CPAs…. This
will open the CPAs dialog:
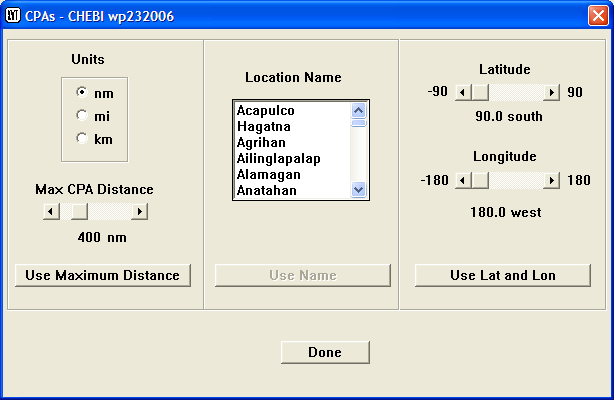
CPAs Dialog
-
Click on the Use Maximum
Distance button. The CPAs text file will be
displayed in a text window:
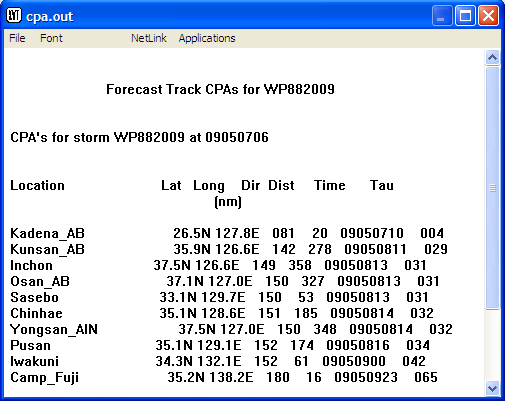
CPAs File Display
Open the File menu
and select Exit to close the
window.
-
Click on the OK
button in the CPAs dialog.
-
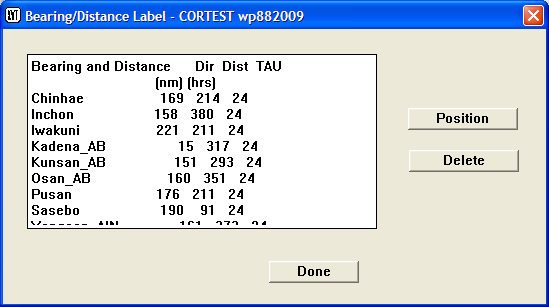
Compute Bearing/Distance to
Forecast. Begin by opening the
Warnings/TCFAs menu from the Menu Bar and
selecting Compute Bearing/Distance to
Forecast…. This opens the Bearing/Distance
to Forecast dialog:
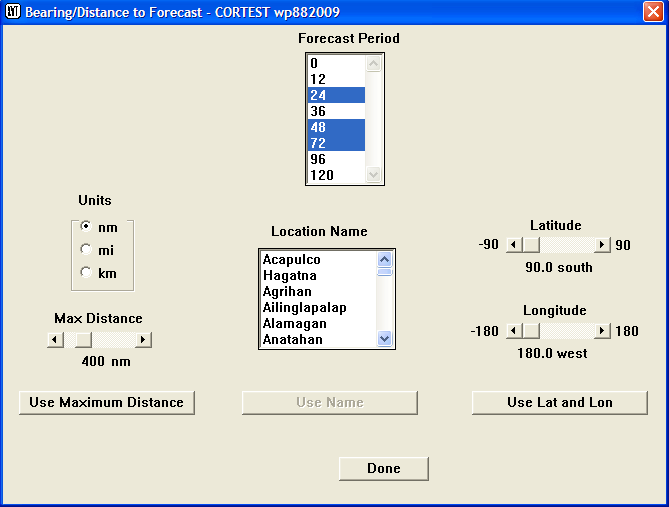
Bearing/Distance to Forecast Dialog
-
Click on the Use Maximum
Distance button. The Bearing/Distance file
will be displayed in a text window:
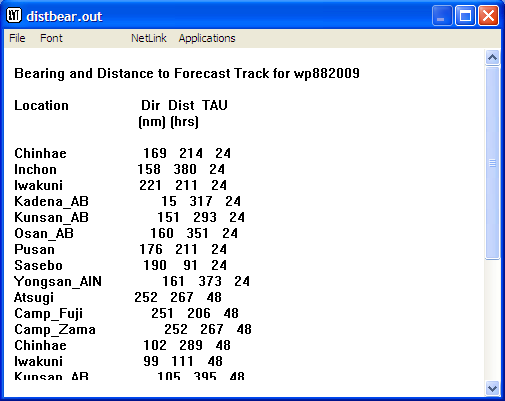
Bearing and Distance to Forecast Track Display
-
In the text window, open the
File menu and select
Exit to close the window.
-
In the Bearing/Distance to Forecast
dialog, click the Done button to
exit.
To create the warning graphic:
-
Snap the map display to the warning
area. Open the Graphic menu from the
Menu Bar and select Snap to warning area.
This zooms the storm window in to the area around your
forecast, within approximately 10 degrees from each
forecast point.
-
Display the forecast track. From
the Graphic menu, select Display
Forecast Track.
-
Display Forecast Track and
Wind Radii. From the Graphic menu,
select Display Forecast Track and
Wind Radii.
-
Display the Error Swath. From the
Graphic menu, select Display Error
Swath. The Error Swath Dialog will be
displayed:
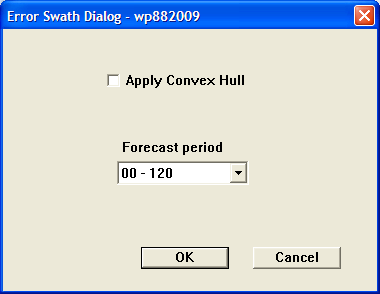
Error Swath Dialog
In general, the Apply Convex
Hull option should not be selected. Only use the
convex hull when the error swath is not representative of
the track uncertainty. Click on the OK
button to close the dialog and display the error swath:
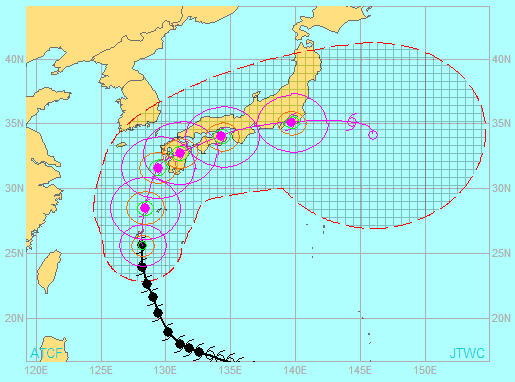
Storm Window Showing Track, Wind
Radii, and Error Swath
-
Edit and position the warning
label. From the Graphic menu, select
Warning Label…. This will open the
Warning Label dialog shown below. If necessary, you can add
additional information (such as “*** FINAL WARNING
***”or “*** RELOCATED ***”) as necessary
by clicking within the text box. Click on the
Position button to position the label
within the storm window – control will be transferred
to that window and you can click anywhere to designate
where the upper left corner of the label will be placed.
Click Done in the Warning Label dialog
when complete.
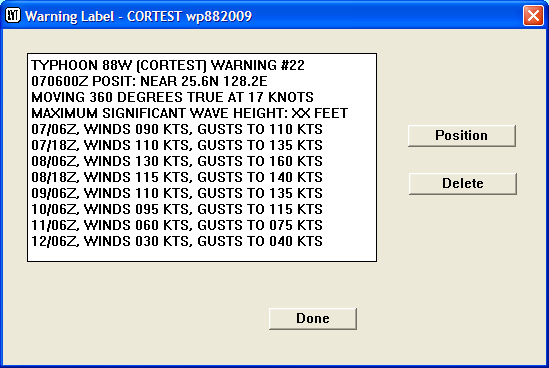
Warning Label Dialog
-
Create and position the CPA
label. From the Graphic menu, select
CPA Label…. This opens the CPA
Label dialog:
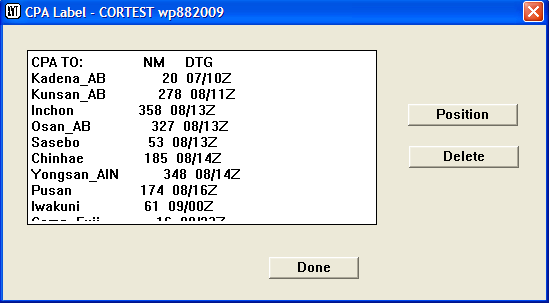
CPA Label Dialog
You can edit within the text box to pare
out superfluous information to save room. Also, don’t
include this label if no CPAs are generated. Click
Position to transfer control to the Storm
Window, where you can click to position the upper right
corner of the label. If you’re unhappy with the
position, click Delete to delete the label
and try again. Click Done when finished to
exit the dialog.
-
Edit and position the
bearing/distance label. From the
Graphic menu, select
Bearing/Distance Label… to open the
Bearing/Distance Label dialog:
Bearing/Distance Label Dialog
You can edit within the text box to pare
out superfluous information to save room. Also, don’t
include this label if no CPAs are generated. Click
Position to transfer control to the Storm
Window, where you can click to position the upper right
corner of the label. If you’re unhappy with the
position, click Delete to delete the label
and try again. Click Done when finished to
exit the dialog.
-
As an alternative to steps 5-7 above,
you can create a single label that combines the Warning,
CPA, and Bearing/Distance information. From the
Graphic menu, select Combined
Warning, CPA, and Bearing/Distance Label….
This opens the Warning Label dialog; if you scroll down you
will see that the CPA and Bearing/Distance information are
included. Note that if no CPA or Bearing/Distance
information was generated, you will need to erase these
manually from the label graphic or just display the Warning
label itself (per step 5 above). You can also manually edit
the label before placing it to remove superfluous
information. Click Position to transfer
control to the Storm Window, where you can click to
position the upper right corner of the label. If
you’re unhappy with the position, click
Delete to delete the label and try again.
Click Done when finished to exit the
dialog.
-
Create and position the warning
legend. From the Graphic menu, select
Warning Legend…. This opens the
Warning Legend dialog:
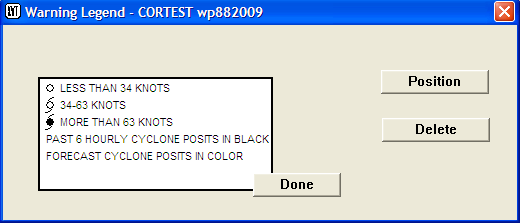
Warning Legend Dialog
Click the Position
button to position the legend in the storm window. The
warning legend is normally placed at the bottom right of
the graphic in the whitespace, but may be placed elsewhere
if there is no room. Click in the storm window where you
want the upper right corner to be placed. If you
don’t like the final placement, click on
Delete to delete the label and try again.
Click Done when finished to close the
dialog.
-
Label the forecast. From the
Graphic menu, select Label
forecast… to open the Forecast Label
Dialog:
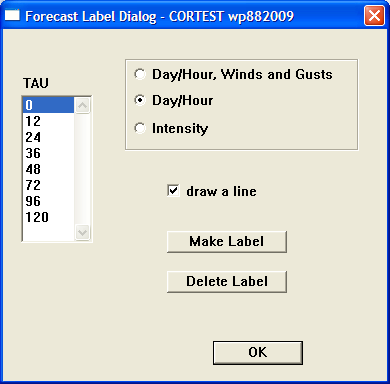
Forecast Label Dialog
For each TAU, click the appropriate
TAU, then click Make
Label. The focus then shifts to the Storm Window,
where the cursor is attached to the end of a line leading
to the position at that TAU. Click and hold the left mouse
button to drag the end of the line to where you want the
label to be placed, then let go of the mouse button. If
unhappy with the placement, click Delete
Label and try again. Otherwise, repeat until all
TAUS are completed. Ensure that the labels don’t
cover geography labels or any forecast information, and
that placement is neat and orderly. Click
OK when done.
-
Display geography labels with
dots. Choose the Geography Labels with
Dots option from the Graphic
menu.
-
(Optional) The High Resolution
Map option in the Graphic menu is
not typically used for any official graphics but may be
used to view smaller islands. This can be useful when only
small scale land features exist within the warning graphic
area. The High Resolution Map may be somewhat slow to
render on the screen.
The finished warning graphic should look
like the one below:
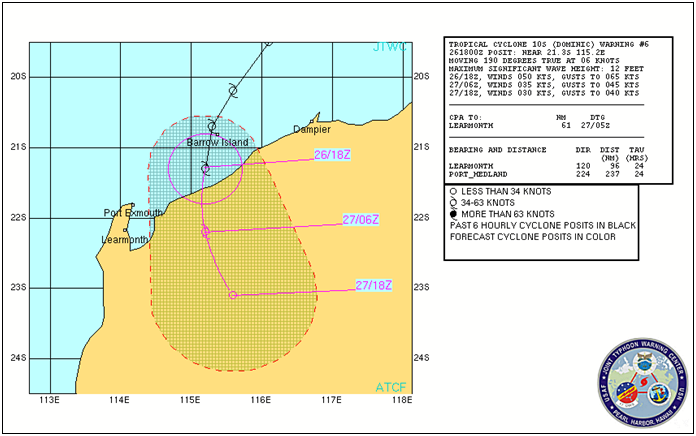
Completed Warning Graphic
-
Save the warning graphic. From
the File menu, select Save
Graphic. A dialog will pop up allowing you to
specify a file name and location.
The steps in this section take you through
the process of creating the Ship Avoidance Area graphic,
assuming that you have already created and saved the Warning
Graphic (see Section 2.23.2, above). To create the Ship
Avoidance Area graphic:
-
Clear the error swath. There are
two ways do clear the error swath from the graphic:
-
In the Sidebar, scroll down to
error swath and click on it. This is a
toggle; clicking on it again will re-display the error
swath.
-
Open the Tools menu
from the Menu Bar and select Select Overlays to
Erase, then select Ship Avoidance Area
Error Swath from the flyout menu.
-
From the Graphic menu
in the Menu Bar, select Display Avoidance
Area. The Ship Avoidance Area dialog will be
displayed:
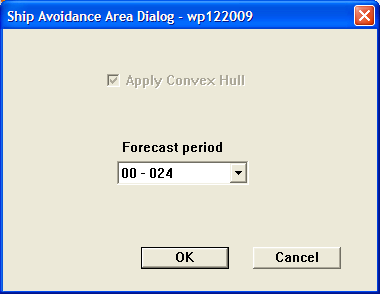
Ship Avoidance Area Dialog
In general, leave the default settings
(shown) on and click the OK button to
close the dialog and display the avoidance area. This is an
area with a dashed outline.
-
The finished product should look
something like this:
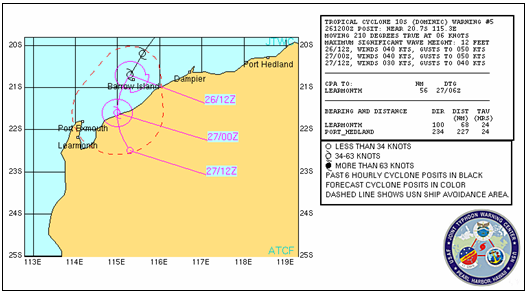
Ship Avoidance Area Graphic
-
Save the Ship Avoidance Area
graphic. From the File menu, select
Save Graphic. A dialog will pop up
allowing you to specify a file name and location.
The Wind Probability products are created
after the warning is complete. To begin, you need to have a
storm window open and display the latest forecast track and
geography labels with dots. No labels or wind radii should be
displayed. To create the wind probability products:
-
From the Graphic menu,
select Display Cumulative Wind Probs, then
select 34kt from the flyout menu. This
will open the GRIB Data dialog:
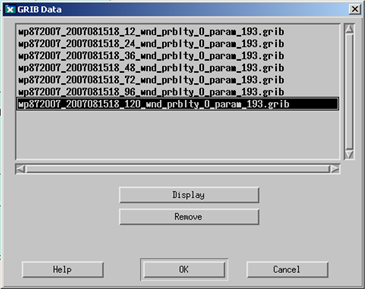
GRIB Data Dialog
Select the ‘120_wnd_prblty’
data. This provides the largest swath and is used mainly to
ensure the window is large enough. Also note that the GRIB
data may not be available until approximately 5-10 minutes
after you create the warning message.
-
Using the Zoom function
(either from the Tools menu or the
Sidebar), re-size the window so that you create a
rectangular box covering the entire wind probability swath.
This is done to ensure that there is not a lot of white
space when the product loops on the web page.
-
From the Graphic menu
in the Menu Bar, select Save 34, 50, 64kt Wind
Probs Graphic to File. This will create the
remainder of the wind probability display and save all of
the wind probabilities to the NIPRnet and SIPRnet web
pages.