This section provides a complete guide to all of the ATCF menus and the options they contain.
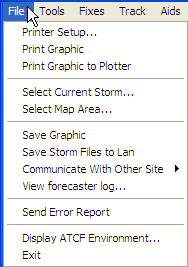
The File menu, shown below, contains printing, storm and map selection, save, communication, and other functions.
The ATCF File Menu
Printer Setup… opens a standard Printer Setup dialog for your computing platform (the example below is for a Windows XP computer). This dialog lets you select the printer to be used, the orientation of the printout (landscape or portrait), paper size, and other options.
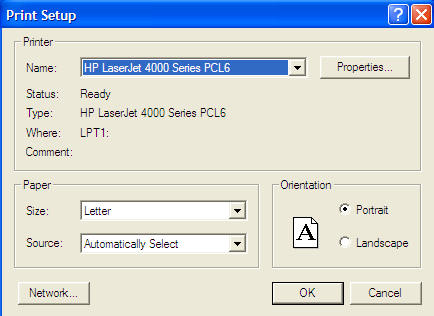
ATCF Print Setup Dialog
This option is apparently not functional at this time; ATCF always prints to the default printer for the host computer.
Print Graphic prints the contents of the map portion of the ATCF window to the printer selected in the Printer Setup dialog. Latitude and longitude lines are shown at 5 degree intervals. The active storm plot is displayed, but geography is not.
Print Graphic to Plotter prints the same graphic to a plotter.
Select Current Storm… allows you to select the current storm from a list box, as shown below. When you have selected a storm, the storm data will be displayed in the map window. Only one storm may be displayed at a time.
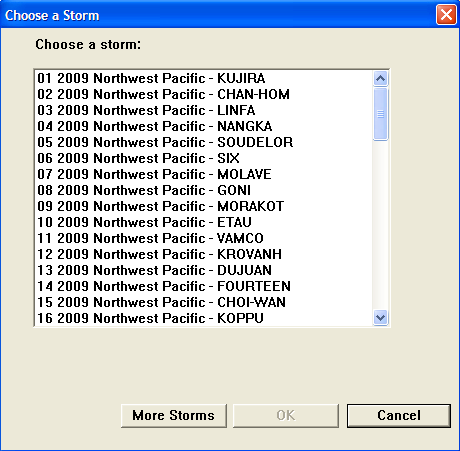
ATCF Choose a Storm Dialog
You can click a storm name (the highlighted storm will be displayed temporarily in the map window) and then click OK to display the storm, click More Storms to display additional (archived) storms, or click Cancel to exit without changing the current storm.
Note that this function is duplicated in the Sidebar on the left side of the ATCF window.
Select Map Area… allows you to select the area to be displayed in the map window. Available areas are shown in a list box as shown below. Click on an area name to highlight it and then click the OK button to change the area displayed in the map window.
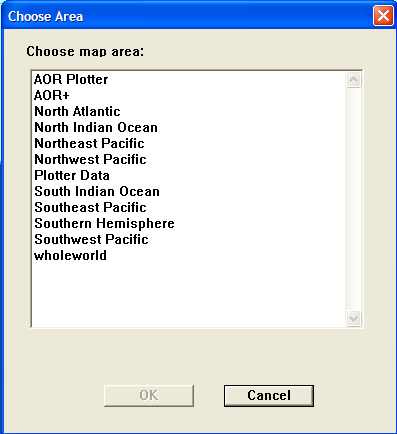
ATCF Choose Area Dialog
This function is also duplicated in the Sidebar on the left side of the ATCF window.
Save Graphic opens a dialog that allows you to save the current contents of the map window as a graphic file. Select or enter a filename and location to which to save the file. If you select an existing filename, the file already saved will be overwritten.
ATCF Save Graphic dialog
Save Storm Files to Lan saves the current storm files to a central repository on the local area network (LAN), so that any changes you have made will be available to other users on the LAN.
Communicate With Other Site opens a flyout menu that allows you to choose actions to communicate storm information and updates to other sites.
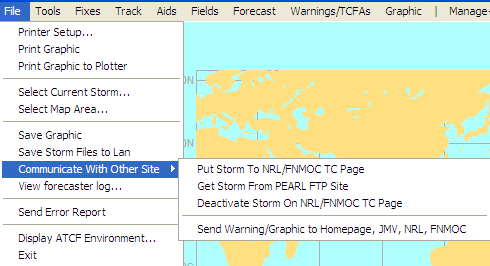
ATCF Communicate With Other Site Flyout Menu
From this menu, you can Put Storm to NRL/FNMOC TC Page, which will cause your storm information to be displayed on web sites at NRL and FNMOC (and on the Naval Enterprise Portal – Oceanography), Get Storm From PEARL FTP Site, which allows you to download storm information from JTWC in Pearl Harbor, HI, Deactivate Storm On NRL/FNMOC TC Page, which causes the storm to be no longer displayed on the NRL and FNMOC sites and NEP-O, and Send Warning/Graphic to Homepage, JMV, NRL, FNMOC, which makes a new warning and/or graphic available to the JTWC home page, the NRL and FNMOC sites, and NEP-O, and also makes them available to users of Joint METOC Viewer (JMV), an application widely used in the fleet for display of METOC information.
View forecaster log… allows you to look at entries in the forecaster log pertaining to the current storm.
Send Error Report opens a text entry box and a confirmation dialog. You can use the text entry box to compose a message to the ATCF developers and system administrators to let them know you have encountered an error and provide specifics. You can cut and paste from any of the other list boxes (i.e. ATCF Environment) to provide supporting information. Click the OK button in the confirmation dialog to send the message or Cancel to close without sending the message.
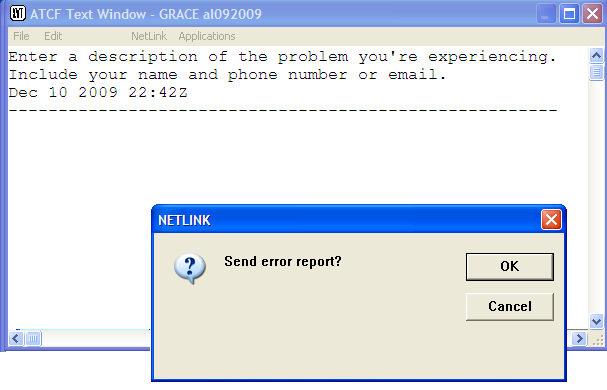
ATCF Error Report Entry Box and Confirmation Dialog
Display ATCF Environment opens a text display window that shows the current software environment for ATCF.
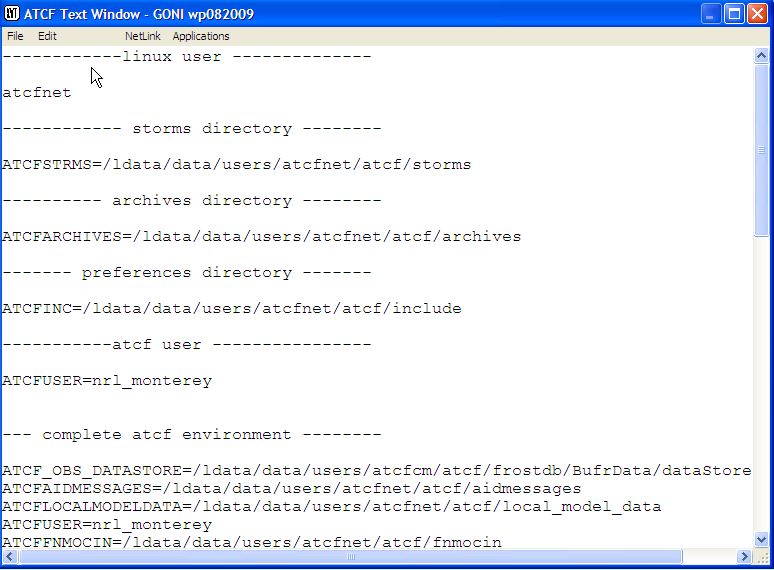
Display ATCF Environment output
Exit terminates the current ATCF session and closes all windows.
The Tools menu contains options for zooming and unzooming the map (some of which are duplicated in the Zoom Buttons on above the Sidebar), to manage overlays, to compute distance between points, to clear the map, and to manage the map display.
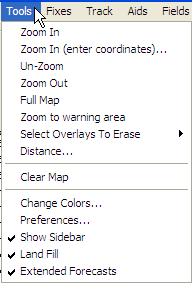
ATCF Tools Menu
Zoom In puts the map in zoom mode. A message appears at the bottom of the map telling you to click and drag to select the zoom area or off the map to cancel. To select the zoom area, press and hold the left mouse button at one corner of the desired area on the map, and drag the cursor (an outline box will appear) until the area you want is contained in the outlined box. Release the mouse button, and the map will zoom in to the desired area. This function is duplicated in the Zoom In button above the Sidebar.
Zoom In (enter coordinates)… displays a dialog that allows you to enter the coordinates of the upper left and lower right corners of the zoom box. Clicking the OK button zooms the map to the desired box.
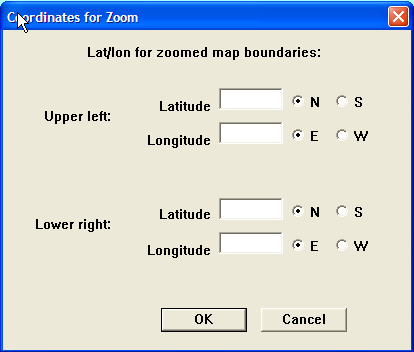
ATCF Zoom Coordinates dialog
Un-Zoom toggles the last zoom off and on. For example, if you zoomed in once and then zoomed in again, the first press of Un-Zoom would go back to the first zoom level. The second press would return to the second zoom level.
Zoom Out simply un-does the last zoom. If, for example, you zoomed in once and then zoomed in again, Zoom Out would simply un-do the second zoom. Additional presses of Zoom Out don’t do anything. This option is duplicated in the Zoom Out button above the Sidebar.
Full Map restores the display to reflect the full map currently selected. This option is duplicated in the Full Map button above the Sidebar.
Zoom to warning area is used to zoom in on the area surrounding the current warning for an active storm. If the currently selected storm is no longer active, an error message will be displayed.
Select Overlays to Erase opens a flyout menu showing all possible overlays on the map window, and allowing you to toggle individual overlays on or off.

ATCF Select Overlays to Erase flyout menu
This allows you to clear unneeded overlays from the map so that you can concentrate on the information you need to work with.
Distance… opens a dialog with instructions for obtaining the distance between two points.
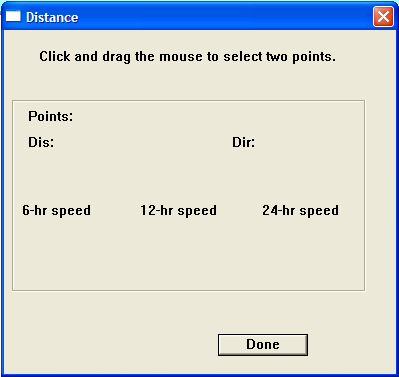
ATCF Distance Dialog
After the click and drag operation, the dialog will show the distance, direction, and 6-, 12- and 24-hour speeds between the points.
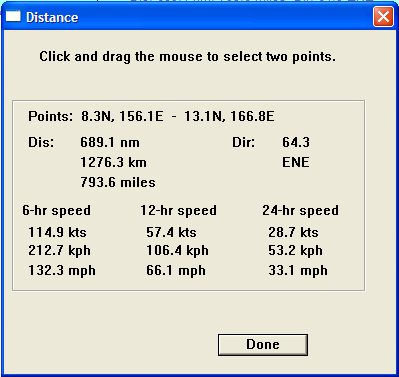
ATCF Distance Dialog After Click and Drag/p>
Clear Map clears all plotted information from the map, leaving only the map background.
Change Colors… opens the Map Display Color Preferences dialog, which allows you to change the colors used to depict various features on the map.
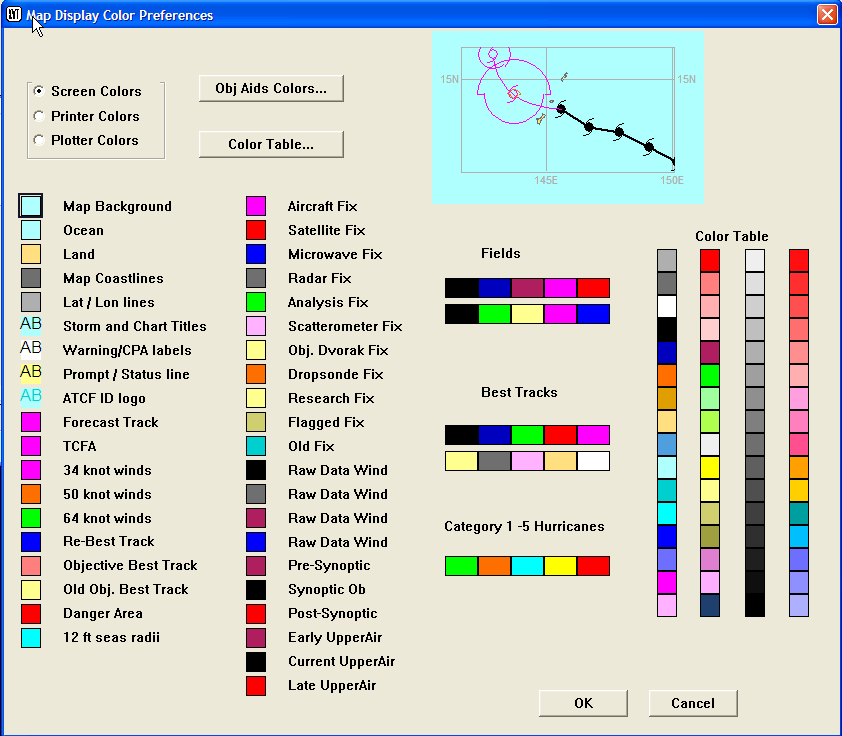
ATCF Map Display Color Preferences Dialog
Show Sidebar toggles display of the Sidebar at the left side of the ATCF window. This also includes display of the Zoom buttons. This item is checked if the Sidebar is currently displayed, unchecked if not.
Land Fill toggles display of the filled areas designating land in the map display. It is checked when the land areas are displayed, unchecked if not.
Extended Forecasts is toggled on to display the extended portion of the aids, or off to only show the aids through Tau 72.
The Fixes menu presents options for displaying, entering, and editing storm fixes, importing fixes from other sources, and checking fix data.
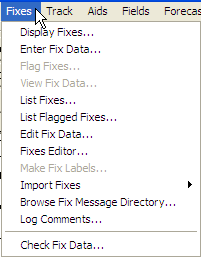
The ATCF Fixes Menu
Display Fixes… plots the fixes for the current storm in the map window. First, the Display Fixes by Site dialog is displayed to let you limit, if desired, the types and sources of fixes to be displayed (default is all fixes). In the center of the dialog are time and period entry boxes; together with the Highlight Fixes checkbox, these are used to highlight (color) all fixes outside the best track time. You can also check the Limit Fix Display checkbox to only display fixes within the selected time frame. The Confidence checkbox, when checked, will cause PCN-based confidence circles to be overlaid over the displayed fixes. The Wind Radii selection toggles display of the wind radii in the fix plots. The Autolabel option will, when toggled on, autolabels selected fixes with DTG, PCH, Current Intensity (CI) in knots, Dvorak final “T”/CI identifier. The Fix Site Labels toggle adds the fix agency to the autolabels. Finally, T and CI labels adds the Dvorak “T” Number (Final T) and Current Intensity (CI), if available.
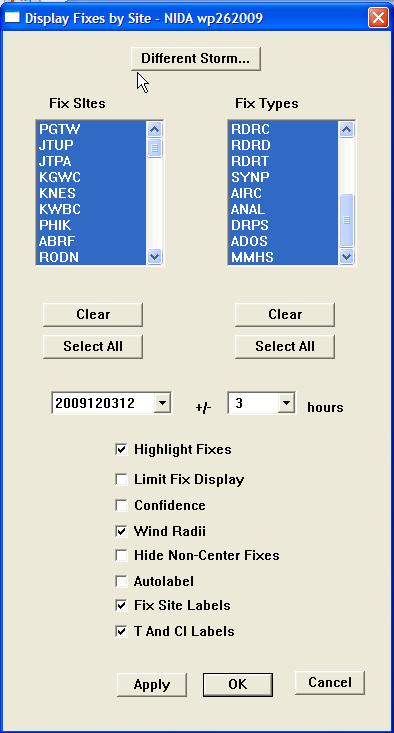
Display Fixes by Site Dialog
Once you have made your selection and clicked the OK button, the desired fixes will be displayed. Note that there are different colors assigned to different fix types; these may be set in the Map Display Color Preferences dialog, available through the Change Colors… selection in either the Tools menu or the Configure menu. Different symbols are used for different confidence levels (good, fair, poor).
Enter Fix Data… is used to enter data for a new fix. If you click this with no storm selected, you will be presented with the Select Storm list box. If a storm is selected, a dialog is presented to allow you to choose which type of fix to enter:
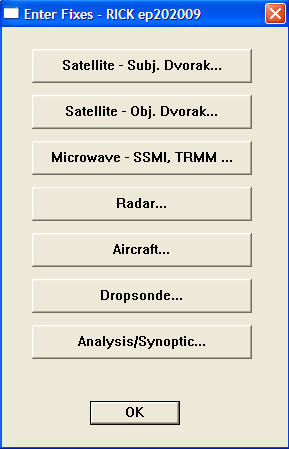
ATCF Enter Fixes Dialog
The type of fix you select will determine what dialog is used to enter the fix.
Satellite – Subj. Dvorak… Allows you to enter a fix determined by the Subjective Dvorak technique. The fix entry dialog is shown below. Most of the entries are self-explanatory. Ensure that you carefully enter all data.
_Fix_Data_dialog.png)
Satellite (Subj. Dvorak) Fix Data Entry Dialog
Satellite (Obj. Dvorak)… opens a dialog for entry of satellite fixes developed using the Objective Dvorak technique. This is only used for computerized fixes, usually automatically imported by CIRA, CIRW, etc. This type of fix is never entered manually.
_Fix_Data_dialog.png)
Satellite (Obj. Dvorak) Fix Data Entry Dialog
Microwave - SSMI, TRMM… opens a dialog used to enter fix data from microwave sensors such as SSMI, TRMM, AMSU, AMSR, SSMS, QSCT, and WIND.
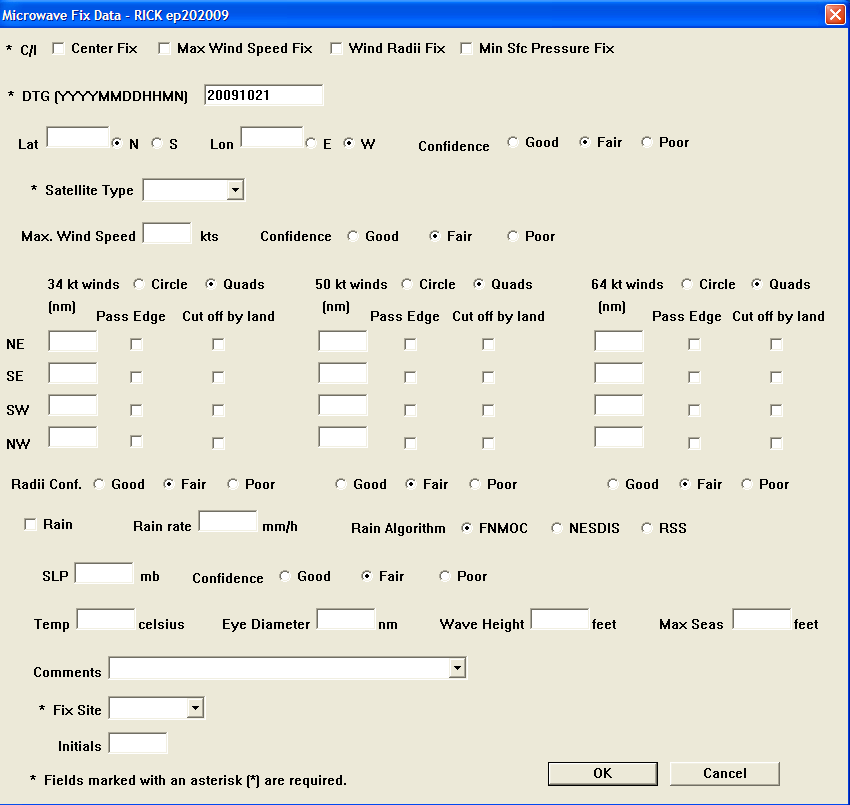
ATCF Microwave Fix Data Entry Dialog
Radar… is used to enter decoded radar observations. At JTWC, these may be obtained either verbally, via FTP, via direct email from 17 OWS and Taiwan CWB, or gleaned from JAAWIN. The WMO number can be either the 5-digit or 4-letter identifier. When ATCF prompts for RADOB code entries, do not put anything on the extra form, just click OK.

ATCF Radar Fix Data Entry Dialog
Aircraft… opens a dialog allowing you to enter fix data from aircraft. JTWC rarely receives aircraft fixes.
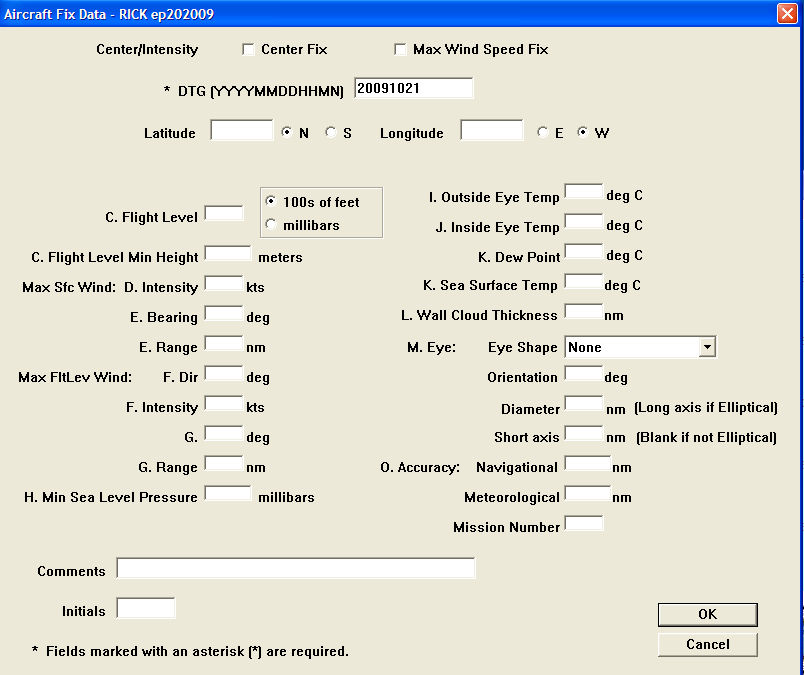
ATCF Aircraft Fix Data Entry Dialog
Dropsonde… allows entry of fix data obtained by dropsonde. JTWC rarely receives dropsonde fixes.
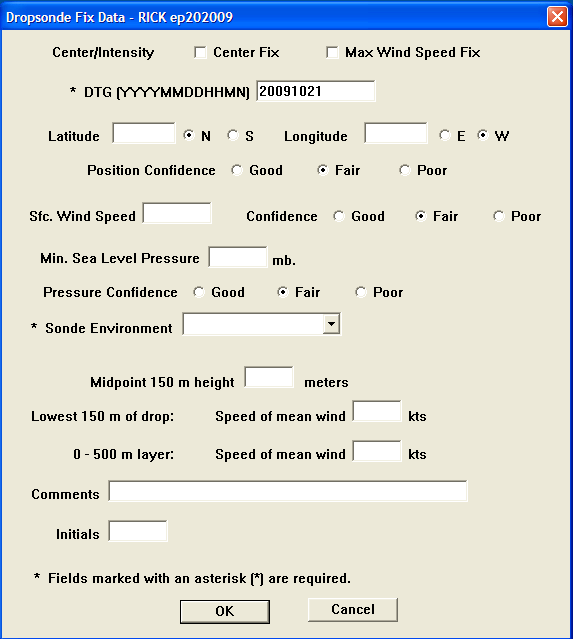
ATCF Dropsonde Fix Data Entry Dialog
Analysis/Synoptic… This option is typically used by TDOs to enter fix data based on a thorough review of synoptic observations (land/ship/buoy), satellite imagery, and other available data.
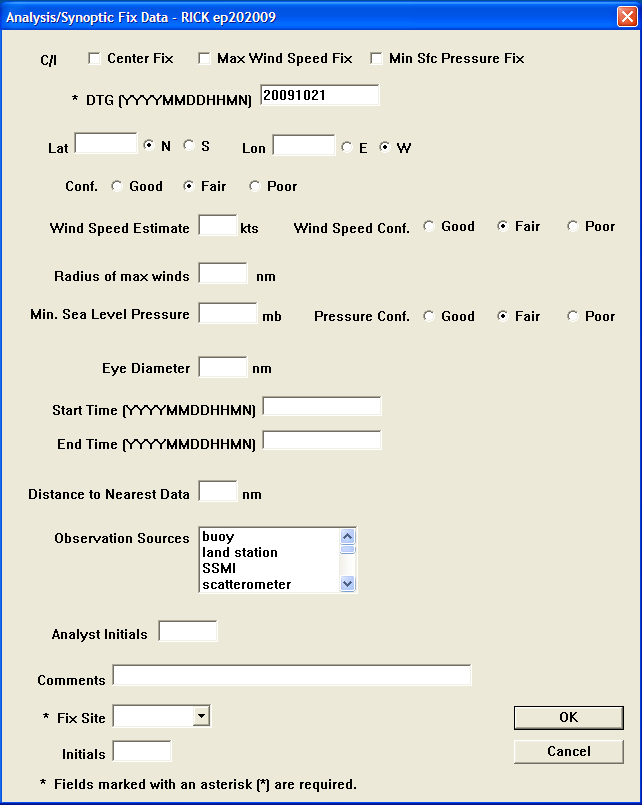
ATCF Analysis/Synoptic Fix Data Entry Dialog
Flag Fixes… allows you to flag individual fixes (i.e. mark them as erroneous or excessively inaccurate) by clicking on the appropriate fix. This will turn each flagged fix yellow, by default (this can be changed using the Map Color Preferences dialog). Once you flag a fix, you are required to log the reason using the “Log Comments…” option (see below).
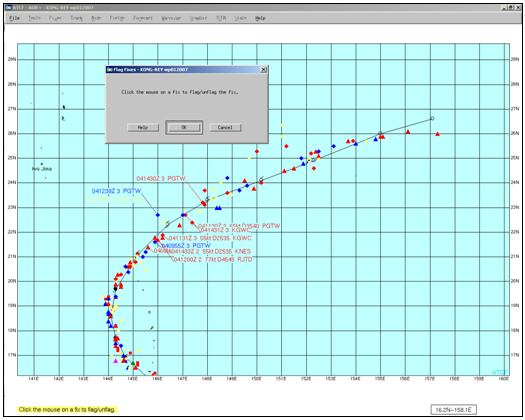
Flag Fixes Example
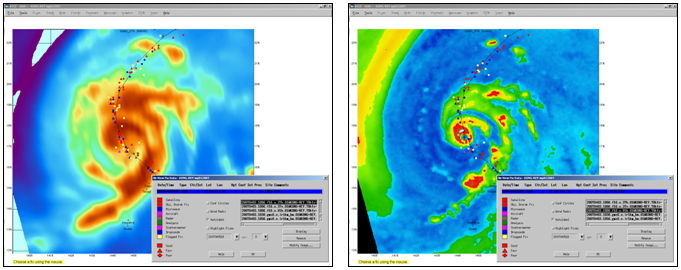
View Fix Data… provides the capability to view the essential fix information for a specific fix by clicking on the fix. It also allows you to view a list of satellite imagery which you can display over the best track and fixes. Clicking on View Fix Data… opens the View Fix Data dialog to allow you to select which fix data are displayed and how they are displayed, and also to select satellite imagery to overlay on the fix data.
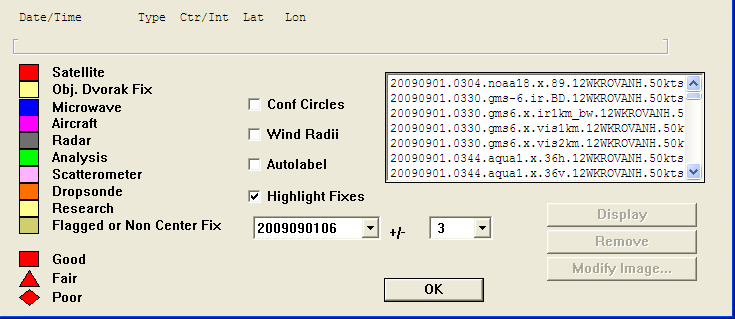
View Fix Data Dialog
You can select the fix(es) to view by selecting its DTG in the box and selecting the +/- range for the DTG in the box next to it. You can also select whether to display Conf Circles and/or Wind Radii, whether to Autolabel the fixes, and whether to Highlight Fixes in the selected time range. In the selection list on the right side, you can select satellite and/or microwave imagery to overlay on the fix. It should be noted that displaying the imagery may take some time, as the imagery is pulled from NRL.
Edit Fix Data… prompts you to select a fix data set, then opens the Fix Record Edit dialog. Choose a fix record by clicking on it, then click Edit Record to edit it (the data entry dialog appropriate to the type of fix selected will open) or Delete Record to delete it.
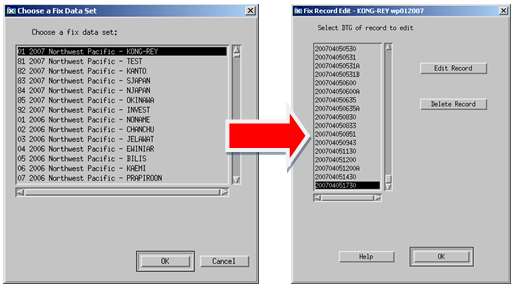
Choosing a Fix Record to Edit
The Help button summons help on the function, and the OK button saves the changes you have made.
Fixes Editor… opens a text edit box that allows you to make multiple changes easily. You need to carefully edit the information since the format is critical; e.g., don’t add any extra spaces and/or information. Highlight and change the information, or move the cursor to the data you want to change and carefully delete and add as necessary. Use the SaveB option under the File menu to save your changes. The Exit option under the File menu can be used to exit without saving any changes.
Fixes Editor Window
Make Fix Labels… allows you to manually label specific fixes and is usually used when best tracking to avoid clustered labeling that occurs when you use the “Autolabel” function. Simply select a fix and then click Position Label or Delete Label as appropriate. Note that this function is not available in WebATCF.
Positioning a Fix Label
Import Fixes is generally used by the TDO to import fixes entered by the satellite analyst. This pulls in all available fixes for display on the TDO’s ATCF. The option opens a flyout menu allowing you to select the type of fixes to import. Typically, it’s best just to select All from the fix type menu when importing.
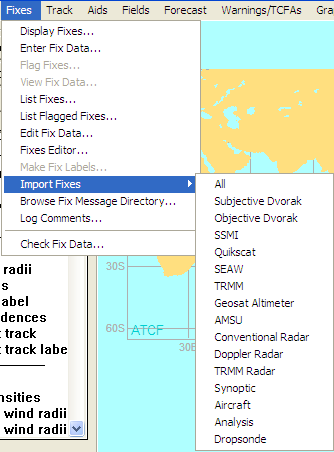
Import Fixes Fix Type Selection Flyout Menu
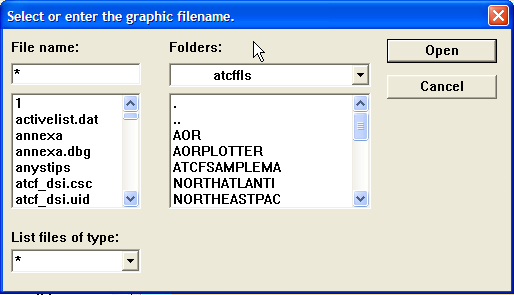
Browse Fix Message Directory… opens a dialog that allows you to look in the fix messages folder to find fixes pertaining to a given storm. The File Name selection allows you to select specific files or all files pertaining to a given storm number (20E in the example). The Folders file lets you select the particular folder(s) in which to search. In the example, the entire fixmessages folder is to be searched; by clicking on 2008 or 2009 in the list box below, you could limit the search to a particular year.
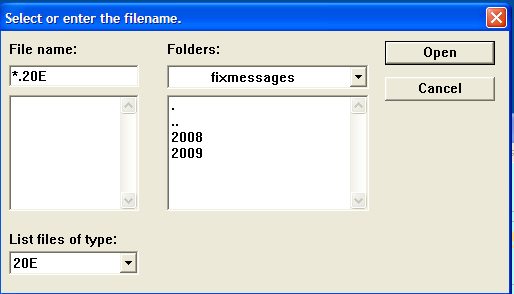
Browse Fix Message Directory Dialog
Log Comments… opens a text edit window allowing you to make freeform comments. TDOs and analysts are encouraged to use this function to explain flagged fixes or comment on fix philosophy.
Log Comments Example
Check Fix Data… opens either a message box saying “There are no errors in the fixes file.” or a text box showing any errors found.
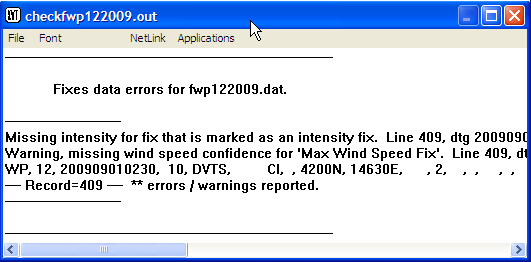
Text Window Showing Check Fixes Results
The Track menu presents a variety of options related to storm tracks and best tracks.
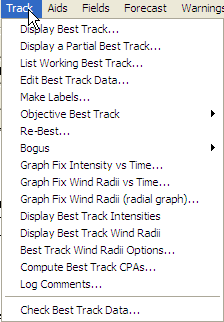
ATCF Track Menu
Display Best Track… This option is not used frequently because, when you select a storm, its specific best track and fixes are displayed by default. You can use this option to re-display the best track after clearing it from the display (perhaps by selecting Clear Map under the Tools, Select Overlays to Erase menu). If there is no storm currently selected, a Choose a Storm dialog will be displayed. Selecting a storm will then display the best track.
Display a Partial Best Track… opens a dialog that allows you to select a segment of the best track to display (or, if no storm is selected, a Choose Storm dialog, then the select segment dialog). You can select a single time in the DTG list box or, by clicking on one endpoint , holding the Shift or Ctrl key and clicking the other endpoint, select a segment of the track spanning multiple times. As you select the segment to display, the display in the map window will change to indicate what you have selected, as shown in the example. The Done key accepts the current selection. The Display Entire Track returns to the display of the entire track.
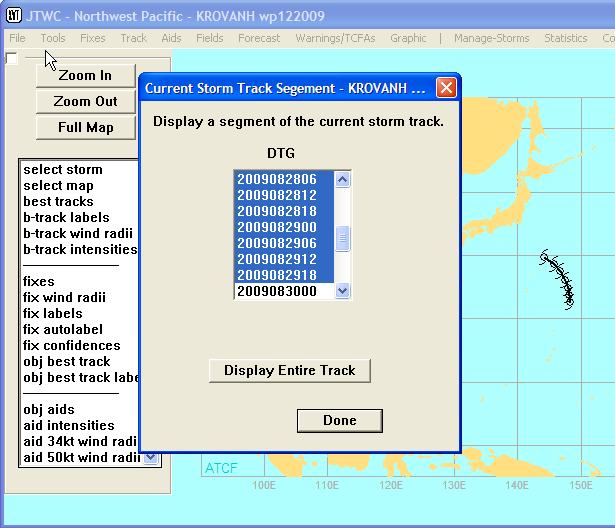
Current Storm Track Segment Dialog
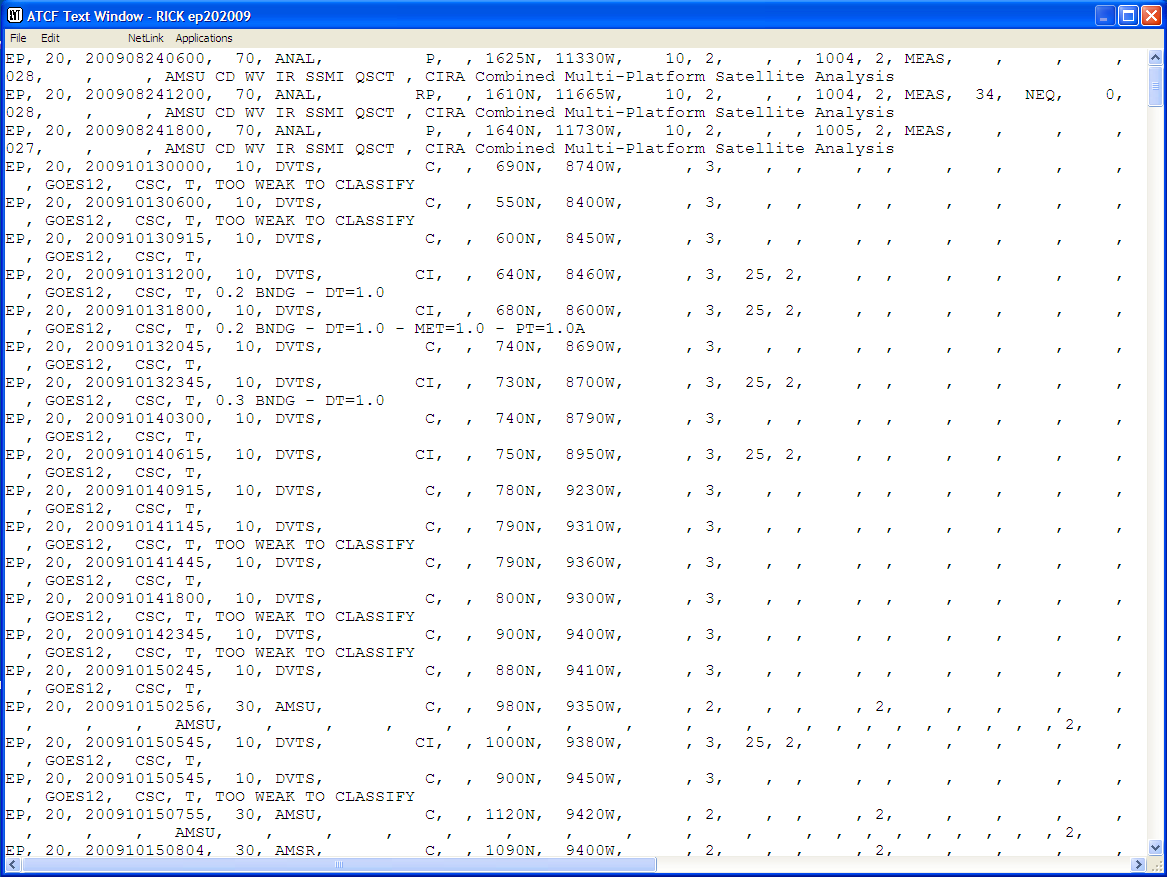
List Working Best Track… opens a display of the current best track information for the selected storm in a text window. You can’t edit this information; however, you can save this file and edit using a text editor.
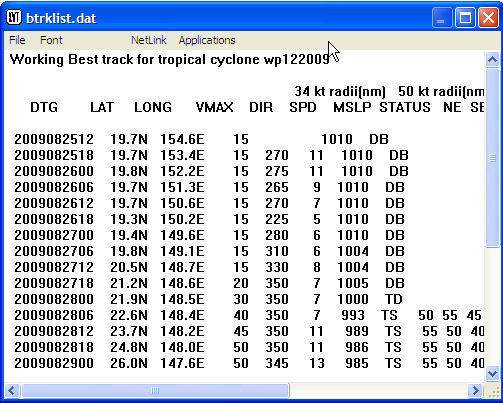
Text Window Showing List Working Best Track Output
Edit Best Track Data… opens a dialog that allows you to edit and change best track information for a specific date-time-group (DTG). Typically the TDO will use the Re-Best function instead, but this interface allows you to input an exact latitude and longitude. Select the DTG from the list box on the left, and the data for that DTG will be displayed for editing. The Cancel button exits without saving your changes. The OK button saves your changes.
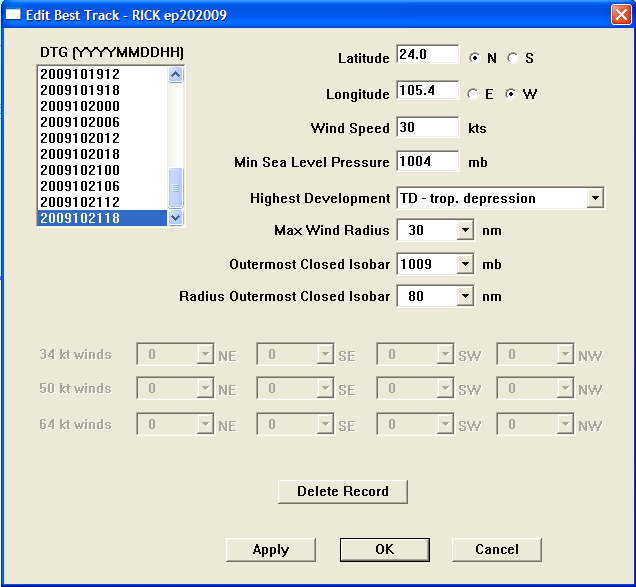
Edit Best Track Dialog
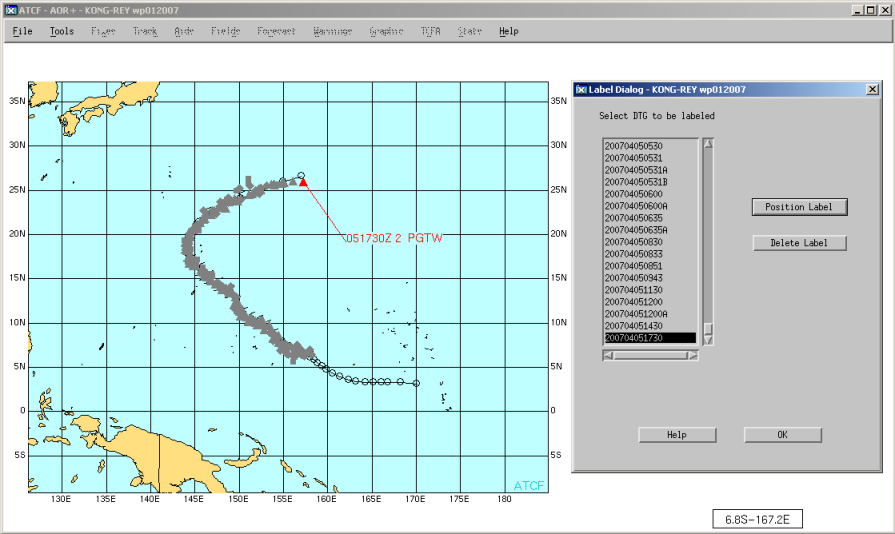
Make Labels… displays the Label Dialog. Select a DTG to which to attach a label. If you click Position Label, the map window will display with an “elastic” line from the plotted point for the selected DTG and the location where the label will be added.
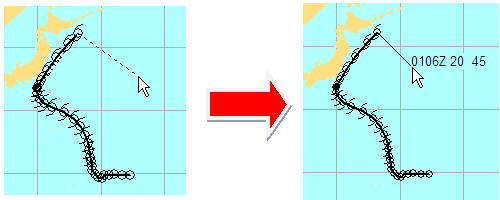
Label Positioning and Result
Objective Best Track opens a flyout menu of objective best track options:
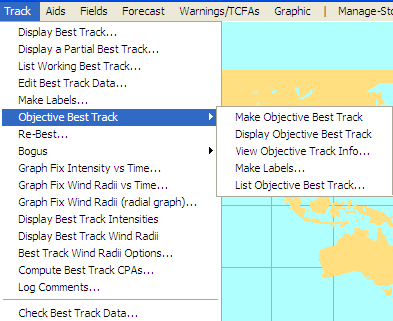
Objective Best Track Flyout Menu
The Objective Best Track should be run at least once per shift and provides an objective, PCN-weighted best track based on all unflagged fixes. It provides additional guidance but should not be used as a solution to all best track determinations. Re-Besting/Best Tracking a storm is an art that requires hard work and detailed interrogation of satellite imagery and additional data, and will be further explained in the Re-Best section below.
Make Objective Best Track creates the objective best track and opens a text window displaying track statistics:
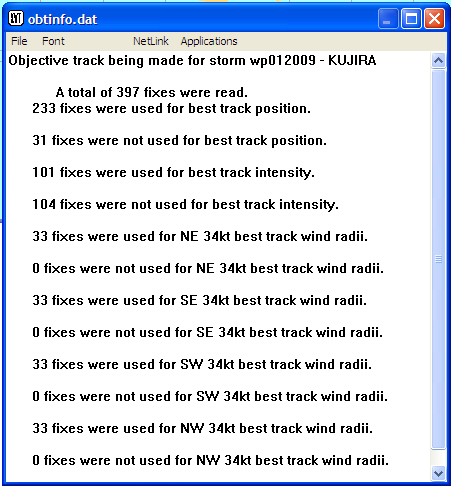
Make Objective Best Track Results Display
This text box provides general information on how many fixes were used and not used to determine the position and intensity. Flagged fixes should not be used but reasoning on why they were flagged should be discussed in the ATCF log. If not, you need to either unflag or add appropriate comments as to why the fixes were flagged.
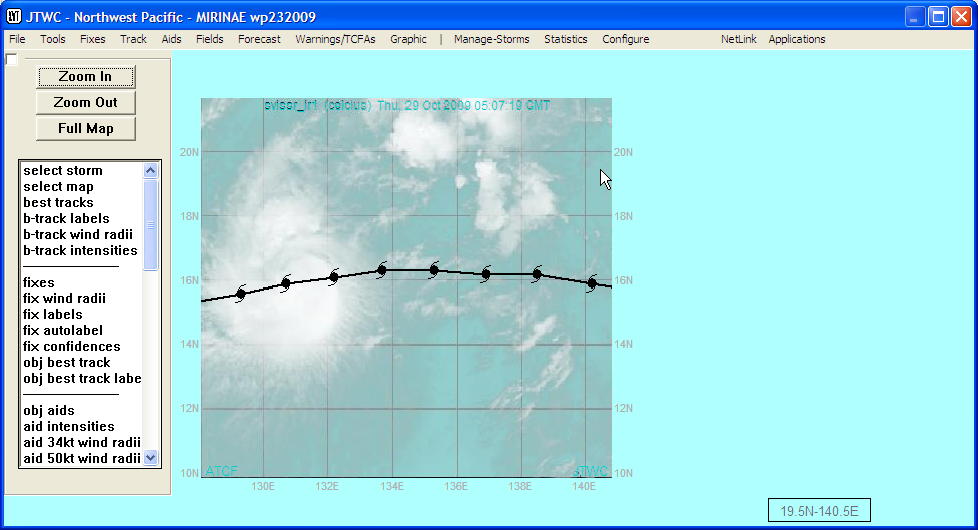
Display Objective Best Track displays the objective best track in the map display.
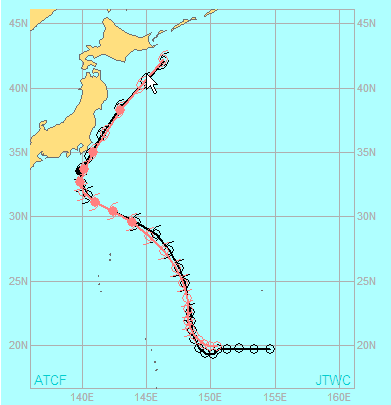
Objective Best Track Display
View Objective Track Info… opens a text window showing the statistics for the objective best track (see the picture above under the Make Objective Best Track item).
Make Labels… displays the Label Dialog. Select a DTG to which to attach a label. If you click Position Label, the map window will display with an “elastic” line from the plotted point for the selected DTG and the location where the label will be added.
>Label Positioning and Result
List Objective Best Track… opens a text box showing the best track information:
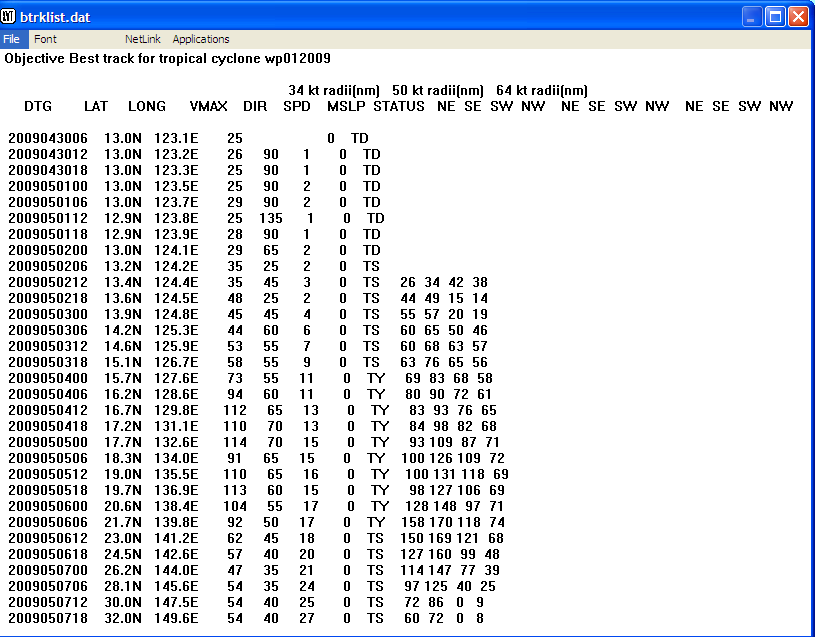
List Objective Best Track output
Re-Best… opens the Re-Best Track dialog to allow editing of the best track positions.
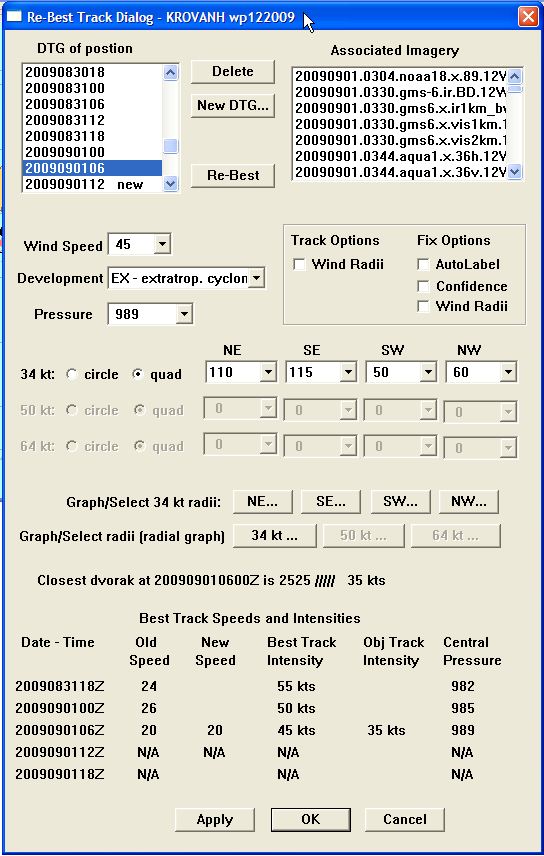
Re-Best Track Dialog
Procedures for re-besting are discussed in Section 2.1.2, Re-Besting. Here we deal in more detail with the options available in the Re-Best dialog.
The DTG of Position list box allows you to select one position to adjust during re-besting. Data for that position will then be shown in the other boxes. The Delete button allows you to delete the currently selected position; the New DTG… button allows you to enter a new position, popping up a DTG entry box. The new DTG will be added to the list and annotated as new. The Re-Best button displays the storm in the map window and invites you to click on the new position on the map, or click off the map to cancel.
The Associated Imagery list box in the upper right corner provides a listing of all satellite imagery pertinent to the selected DTG. Double-clicking on an image file will cause the image to be overlaid on the map window along with the storm information:
Map Window Showing Best Track and Satellite Imagery Overlay
The list boxes for Wind Speed, Development, and Pressure allow you to change those parameters manually. The check boxes under Track Options and Wind Options allow you to decide what will be displayed for the track and/or fixes in the map window.
The check boxes and list boxes for wind radii in the center of the dialog allow you to change the wind radii manually, with the option to set wind radii for a complete circle or individual quadrants.
Alternatively, there are two options for graphically selecting wind radii. For the 34-knot wind radius, you can click on the Graph/Select 34kt Radii button for the desired quadrant. This opens an interactive graph of wind radii versus time:
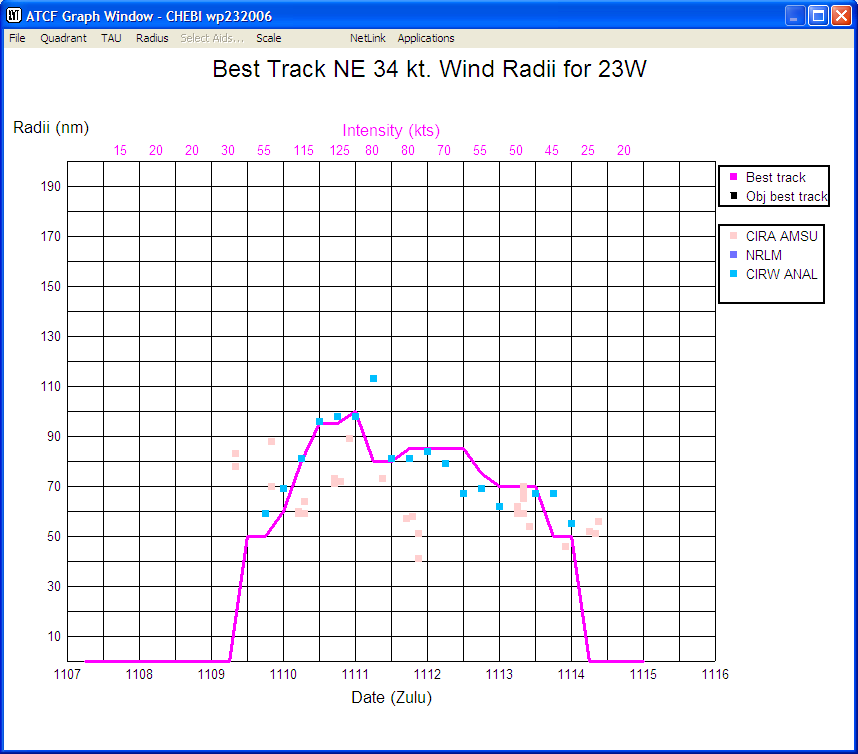
Graph Window Showing Wind Radius Versus Time
You can click on the graph, for any of the displayed times, to adjust the wind radius for the select quadrant for that time. The graph will adjust to show the new wind radius.
For all wind radii, you can click on one the Graph/Select Radii (radial graph) button for the desired wind speed. This opens an interactive radial graph of wind radii for the selected wind speed at the selected time. You can click on the graph to adjust the wind radius in each quadrant of the storm separately. The graph will adjust to show the new wind radius.
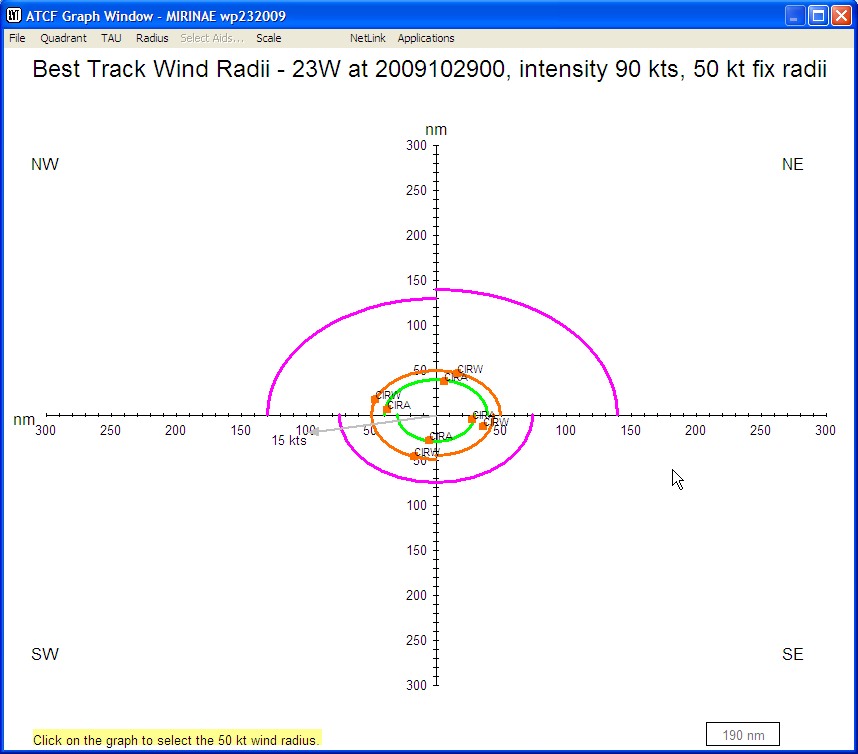
Radial Graph of Wind Radii
As you make changes, the display at the bottom of the Re-Best dialog will change to show the old and new values. The Applybutton applies your changes to the storm record without closing the Re-Best dialog. The OK button applies the changes and closes the dialog. The Cancel button exits the dialog without implementing any changes to the storm record.
Bogus… is used to create a TC bogus that will insert information about the TC into specific models to improve how they initialize the TC and improve model performance. Selecting Bogus… from the Track menu opens a flyout menu whose options capture the steps for creating and sending the TC bogus:
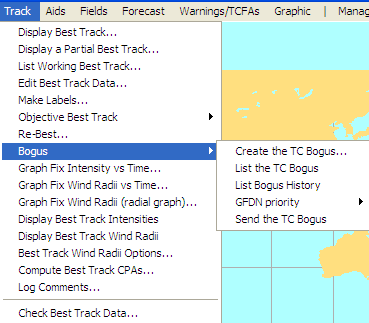
Bogus Flyout Menu
Create the TC Bogus… opens a Prepare Compute Data dialog used to create the bogus. Enter the key information in the dialog (shown below), to include Eye Diameter, Max Wind Radius, Vertical Extent of Circulation, Central Pressure, Outermost Closed Isobar, and Radius of Outermost Closed Isobar. The other information is created and automatically updated when you best track the position.
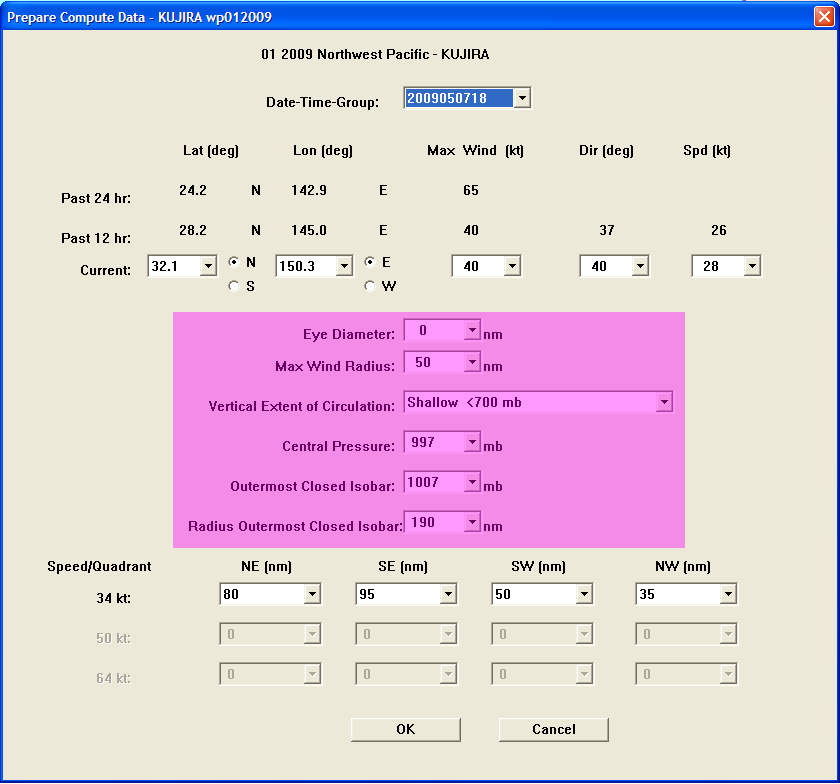
Prepare Compute Data Dialog
Eye Diameter: Obtain from Satellite Analyst (must be eye, not banding eye).
Max Wind Radius: Self-explanatory.
Vertical Extent of Circulation: Generally, D=Deep (>400 mb), M=Medium (700-400 mb), and S=Shallow (<700 mb). Generally Deep>90KTS, Medium 55-90KTS, Shallow <55KTS.
Central Pressure: Automatically generated based on Knaff-Zehr wind-pressure relationship.
Outermost Closed Isobar: Use GFS model analysis of SLP. Identify the outermost closed isobar. At JTWC, this is typically done using JMV on the SIPRNET computer.
Radius of Outermost Closed Isobar: Use GFS model analysis of SLP. Identify the outermost closed isobar and identify the radius.
List the TC Bogus opens a text window showing the bogus information. Check the bogus information prior to sending, to ensure all data is correct.
List TC Bogus output
List Bogus History Allows the TDO to view previous boguses and to maintain consistency unless change is deemed necessary.
List Bogus History output
GFDN Priority... Opens a flyout menu that allows you to set the priority for multiple systems and is self-explanatory. Determine which is your highest priority storm, e.g. STY 12W is threatening Kadena (GFDN – Priority 1) and 90W (FAIR) in the middle of nowhere (GFDN – Priority 2). This is strictly a judgement call and is more critical when you have 3 or 4 areas due to the processing limitations of GFDN.
Send the TC Bogus transmits the TC bogus to FNMOC. Use this option only after you have completed and checked your bogus. You will receive an email from FNMOC confirming bogus receipt for the GFDN model run 2-3 hours after sending the bogus.
Graph Fix Intensity vs Time… Plots the best track intensity versus key agency fixes using the current intensity.

Plot of Fix Intensity vs Time
Graph Fix Wind Radii vs Time… Plots wind radii from fixes versus time.
Plot of Fix Wind Radii vs Time
Graph Fix Wind Radii (radial graph)… plots the fix radii for the current time on a radial graph.
_output.png)
Plot of Wind Radii on Radial Graph
Display Best Track Intensities plots the intensities alongside the best track fixes in the map display.
Display of Best Track Intensities
Display Best Track Wind Radii plots the wind radii around the best track positions in the map window.
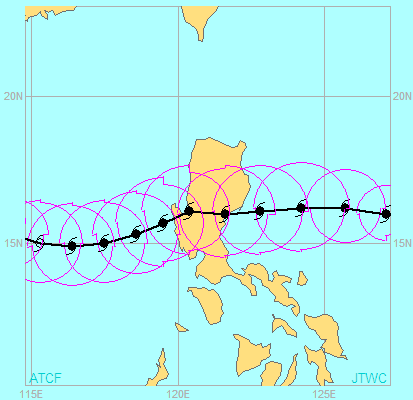
Display of Best Track Wind Radii
Best Track Wind Radii Options… presents a dialog that allows you to select the wind radii to be plotted by DTG, or to display or clear all wind radii for all DTGs.
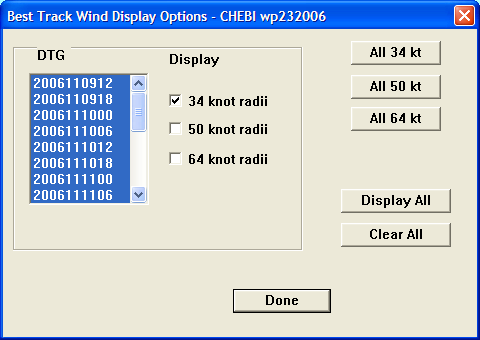
ATCF Best Track Wind Display Options Dialog
Compute Best Track CPAs… opens a dialog that allows you to select the units in which the CPAs will be expressed, the locations for which CPAs will be calculated (chosen from a list), or a location based on latitude and longitude.
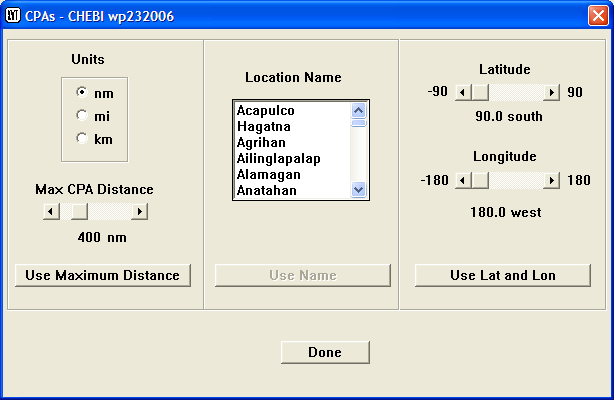
CPA Selection Dialog
Log Comments… opens an editable text window that allows you to log comments. Ensure that you log any pertinent best track comments that pertain to positioning and intensity determination. What data did you use to determine your best track position? Include key microwave, quickscat, etc. imagery and what features you based your forecast on.
Log Comments Window
Check Best Track Data… checks for errors in the best track file. If any are found, a text window showing the errors is opened. Otherwise, a message appears to tell you there are no errors in the best track file.
The Aids menu provides options for working with the various computer-produced objective aids that are used by the TC forecaster.
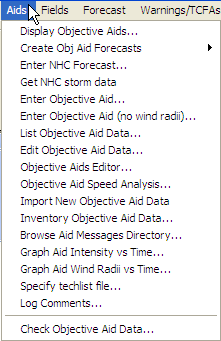
Aids Menu
Display Objective Aids… opens the Objective Aids dialog shown below, which allows you to select the aids to be displayed.
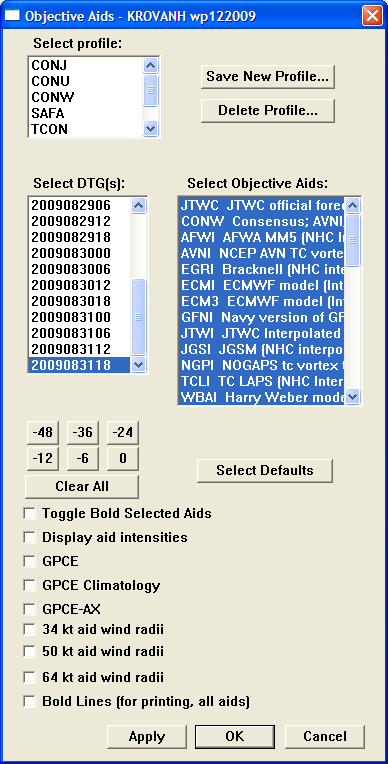
Objective Aids Dialog
Select profile: This list box allows you to select a profile, which is a particular package of objective aids used in creating the 5-day objective aids graphic. There are a variety of existing profiles available; as you select a profile the highlighted items in the Select Objective Aids list boxwill change to indicate which aids belong to the currently selected profile.
Save New Profile… allows you to save and name a new profile containing the aids currently selected in the Select Objective Aids list box. On clicking this button, the Save Profile dialog is presented:
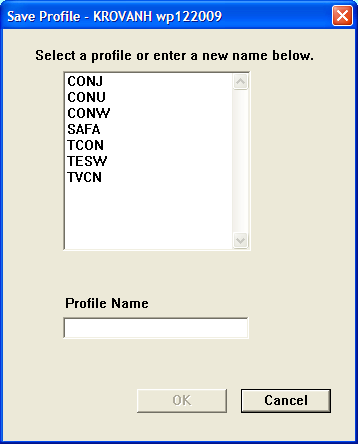
Save Profile Dialog
You can either select an existing name (the contents of the profile will be replaced), or enter a new profile name in the entry box. Clicking the OK button (enabled when a name is entered) saves the new or revised profile; clicking Cancel exits without saving the changes.
Delete Profile opens a selection dialog that allows you to select one of the current profiles for deletion. Clicking the OK button deletes the profile; clicking Cancel exits without deleting the profile.
Select DTG(s) allows you to select one or more date-time groups to display aids for. You can click on a single DTG to select it. You can select a range of DTGs by clicking the first one, holding down the Shift key, and clicking the last one. You can also select multiple DTGs (not necessarily consecutive) by clicking the first, holding down the Ctrl key, and clicking each successive selection. The selected items will be highlighted.
Select Objective Aids allows you to manually select the aids you want to display. You can use this option to manually change the contents of the selected profile if you either don’t want to display all of the aids in the profile or want to display aids that aren’t in the profile. The best method for selecting/deselecting individual aids to add to or delete from the profile set is by holding the Ctrl key and clicking to toggle the status of individual aids. That way you can turn an individual aid on or off without affecting the status of the others in the profile. Remember that you can save your selections in a new profile, if desired, for future use. Also note that the Select Objective Aids list remains active while aids are being displayed and can be used to turn on or off items in the display.
Select Defaults button selects the default aids for the current profile and DTG. The defaults can be set using the Change Objective Aids Defaults… option under the Configure menu.
Time Buttons (-48, -36, etc) are used to select the base time of the aids displayed (in hours before the current synoptic time). Selecting aids run earlier can give you a feel for the accuracy of the aids in predicting the current storm. Selecting 0 displays the aids related to the current synoptic time, to assist the forecaster in forecasting the storm track and intensity. Clicking any of the time buttons displays the aids for that time in the map window:
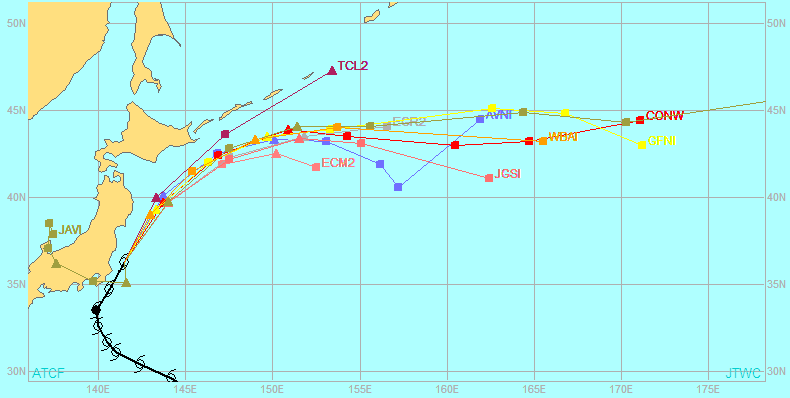
Map Window Showing Aids
Toggle Bold Selected Aids, when checked, causes the aids to be displayed with wider lines and larger dots.
Display aid intensities, when checked, displays the intensities predicted by the aids in the map window along with the aids themselves:
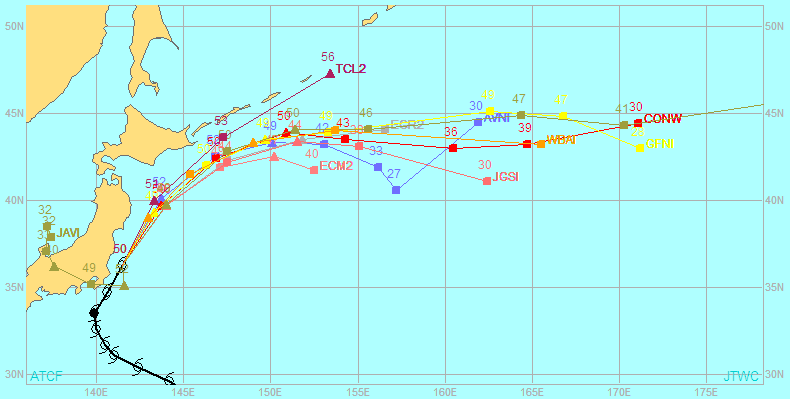
Map Window Showing Aids and Intensities
GPCE, when selected, displays the output of the Goerss Probability Consensus Error (GPCE) product on the map display. The GPCE output is a circular radius around the consensus model forecast positions, within which the verifying TC position is expected to be contained approximately 70% of the time.
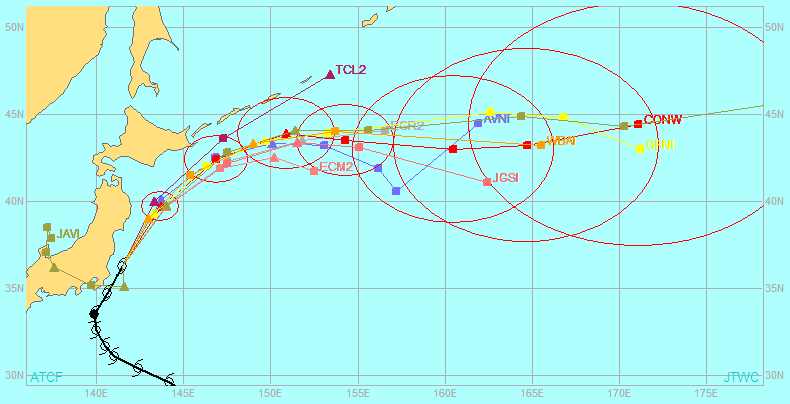
Map Window Showing Aids and GPCE
GPCE Climatology, when selected, displays the GPCE climatological radii. These radii are 3-5 year average GPCE radii and are used to determine relative size of a given GPCE radius to the climatological average.
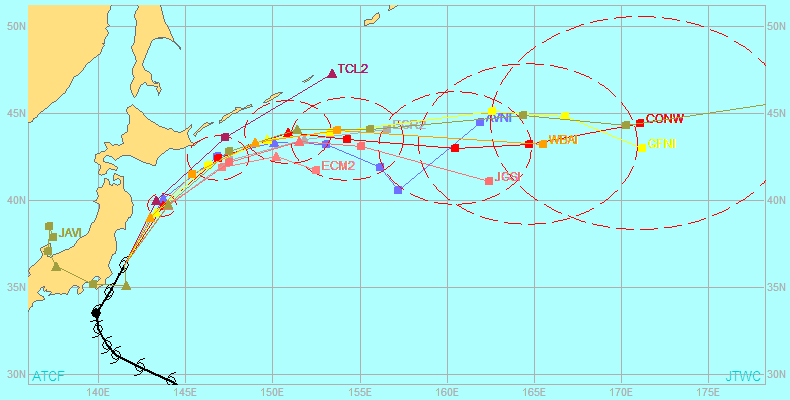
Map Window Showing Aids and GPCE Climatology
GPCE-AX, when selected, displays the output of the GPCE Along and Cross Track (GPCE-AX) product on the map display. GPCE-AX provides separate along- and cross-track error distances rather than a circular radius as in GPCE. The GPCE-AX plot is of error ellipses rather than circles. Typically the along-track distance is greater than the cross-track distance, and the cross-track distance is less than the GPCE circular radius, so GPCE-AX is a better predictor for landfall because it results in a smaller error cone.
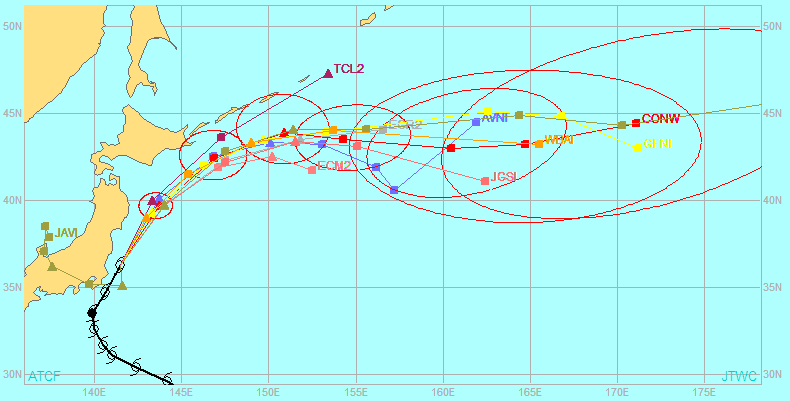
Map Window Showing Aids and GPCE-AX
34, 50,64 kt aid wind radii checkboxes can be toggled on and off to display or not display the selected wind radii from the objective aids.
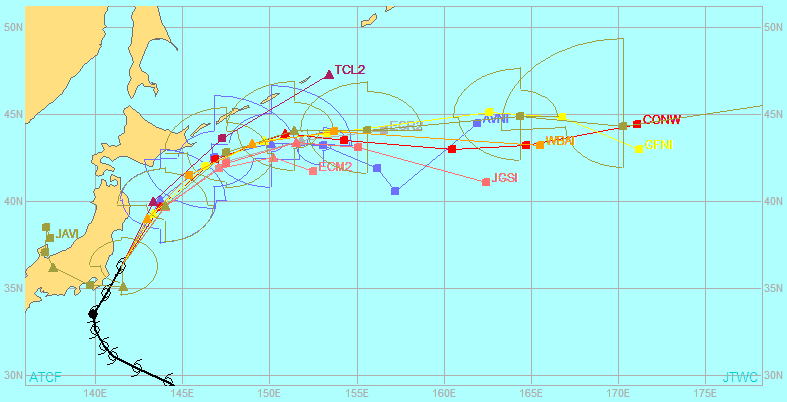
Map Display Showing Aids and Aids 34-kt Wind Radii
Bold Lines (for printing, all aids) causes all aids to be bolded to stand out better in printouts.
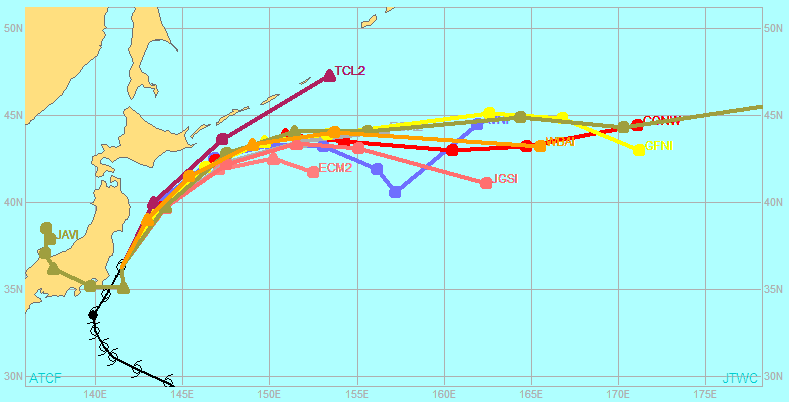
Map Display With Aids Lines Bolded
Create Obj Aid Forecasts… opens a flyout menu showing options associated with creating objective aids forecasts:
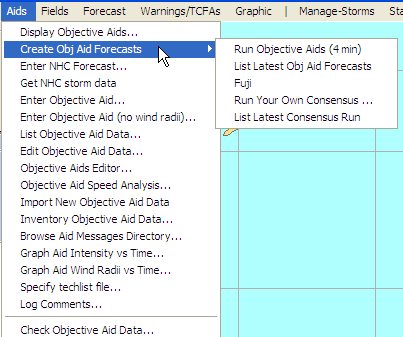
Create Obj Aids Forecasts Flyout Menu
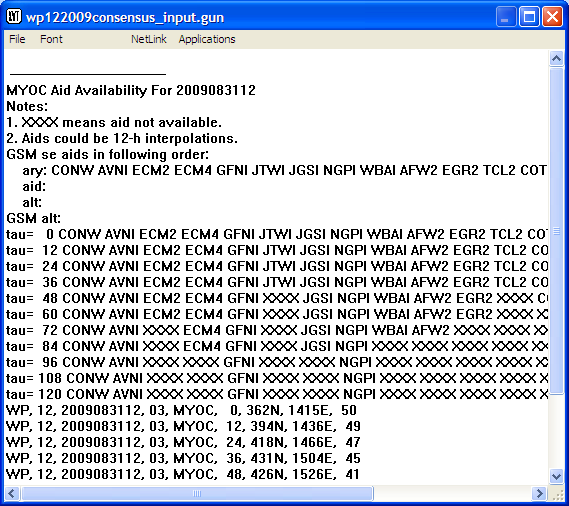
Run Objective Aids (4 min) is used to generate the Consensus Forecast. Running the objective aids takes several minutes and generates a text file (see below) with information regarding the aids including the location, intensity, wind radii and forecast location, and intensity and wind radii for the Consensus forecast. The BAMS and Weber Barotropic (WBAR) models are produced at NRL and imported into ATCF via the Import New Objective Aid Data process; the trackers are then generated in ATCF with the Run Objective Aids command.
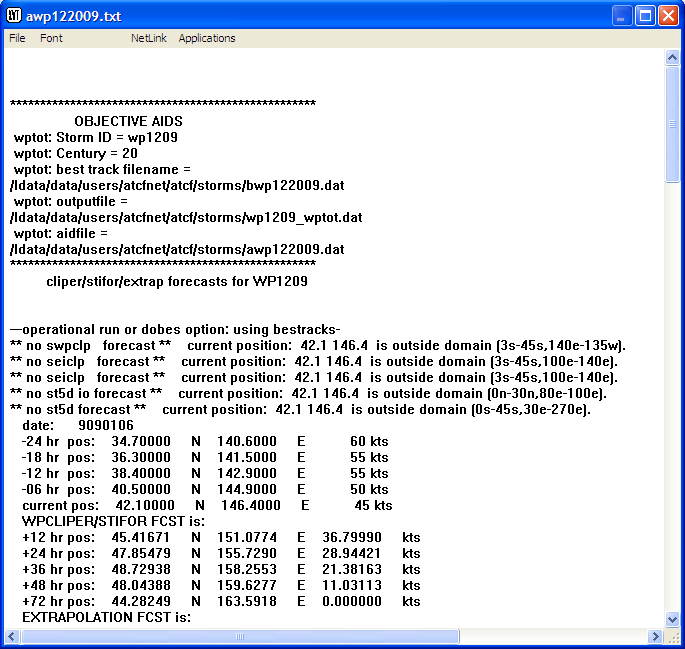
Run Objective Aids Output
List Latest Obj Aid Forecasts provides the same output as above, for the latest run of objective aid forecasts.
Fuji produces an aid for forecasting the motions of two storms that are close enough together to interact. Results are shown in a text box.
Run Your Own Consensus… opens the Run Your Own Consensus dialog which allows you to choose DTGs, profiles, and/or individual aids on which to base a consensus forecast.
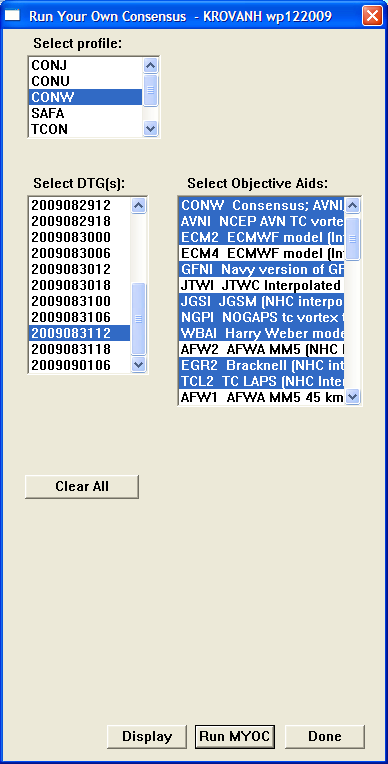
Run Your Own Consensus Dialog
List Latest Consensus Run displays a text box showing the results of the latest consensus run.
List Latest Consensus Run Output
Enter NHC Forecast… is used in conjunction with Get NHC storm data (see below) to enter NHC/CPHC data into the ATCF for East Pacific (east of 140W) and Central Pacific (Dateline east to 140W) tropical systems. The Typhoon Duty Assistant at JTWC typically enters this data, and has a comprehensive operating instruction on this process.
Some precautions to take when using the Enter NHC Forecast…and Get NHC storm data commands:
The process of Get NHC storm data requires an initial invest to be opened; the data it contains will be overwritten with the data from NHC/CPHC (CAUTION: When opening an invest in the Central or Eastern Pacific, do not communicate the position to the NRL/FNMOC TC pages unless NHC or CPHC are not rebesting the same invest). The Get NHC storm data process should be completed whenever the best track is required to be updated on each synoptic cycle.
The NHC/CPHC forecasting requirements are similar to JTWC requirements for the Western Pacific, but there are differences in technique.
Unless there are significant differences, the JTWC forecast for a Central or East Pacific tropical system will just be a reissue of the official NHC/CPHC forecast.
Selecting the Enter NHC Forecast option opens the NHC Forecast dialog shown below.
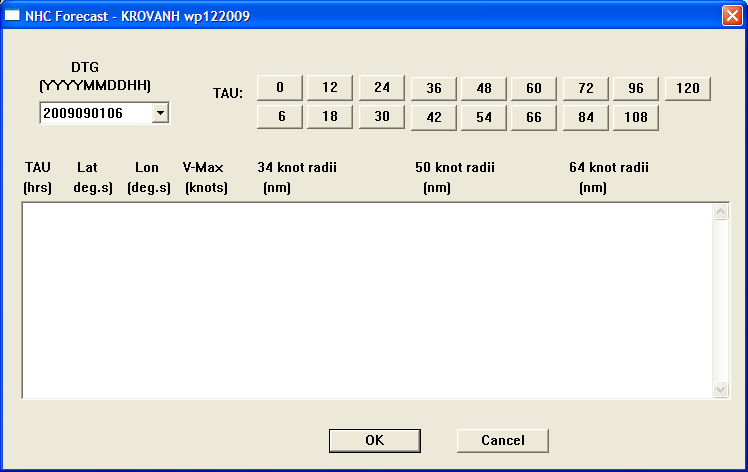
NHC Forecast Dialog
Selecting a DTG in the list box in the upper right and a tau from the buttons on the upper left opens the Enter NHC Forecast dialog, into which you can enter the NHC forecast data. Entries are self-explanatory.
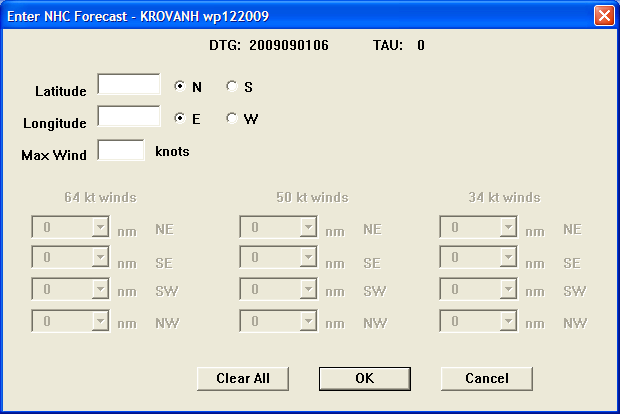
Enter NHC Forecast Dialog
Get NHC storm data gets data for an Eastern Pacific or Central Pacific storm. See the notes above on using this process and Enter NHC Forecast.
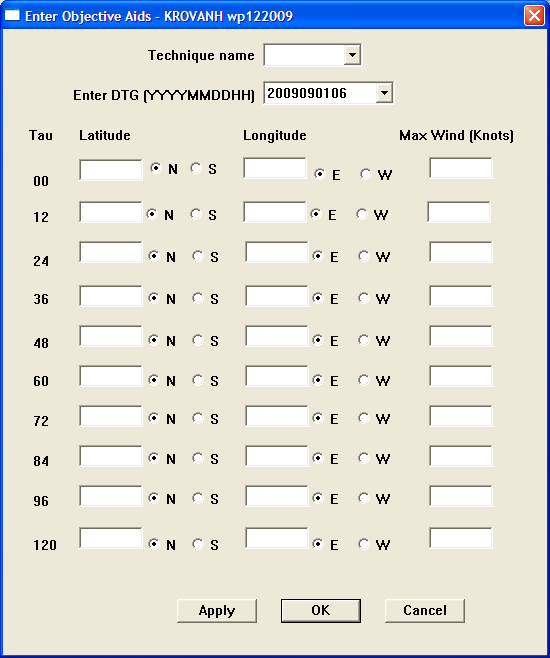
Enter Objective Aid… is used to manually enter data from an objective aid from an outside source (either a model run or another agency) that includes wind radii. To enter data from an objective aid without wind radii, see Enter Objective Aid (no wind radii) below. The Enter Objective Aid… option opens the Enter Objective Aid dialog shown below:
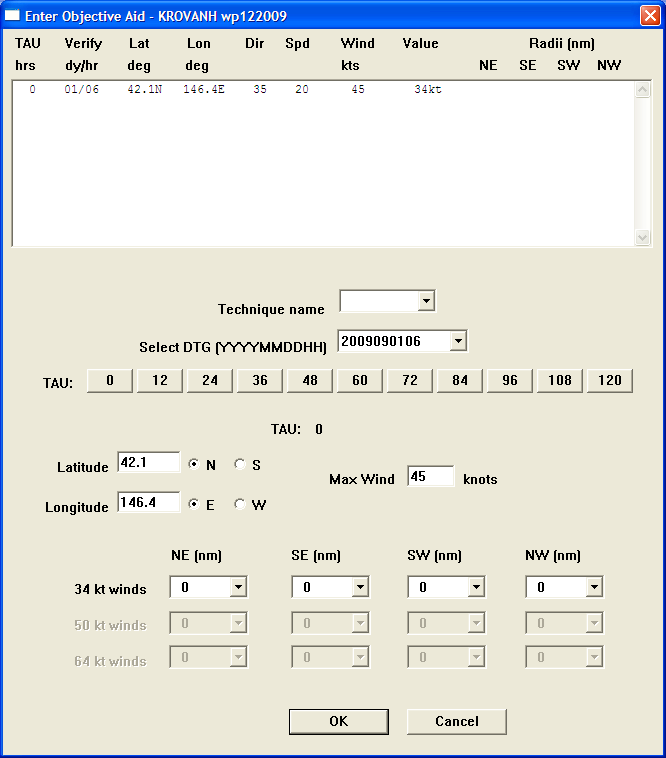
Enter Objective Aid Dialog
In this dialog, you need to select the Technique name (the model name or agency abbreviation) from the drop-down list, select the DTG for the forecast from the drop-down list, and then enter the forecast itself. Click on one of the TAU buttons to enter the forecast for that tau, then enter the Latitude, Longitude, Max Wind, and the wind radii for each quadrant of the storm. Then proceed to the next tau until all are entered. Click the OK button to save the forecast. You must then run the Import New Objective Aid Data, Create Obj Aid Forecasts, and Run Objective Aids commands in order to generate and display the appropriate forecast trackers in ATCF.
Enter Objective Aid (no wind radii)… opens the alternative Enter Objective Aid dialog shown below.
Enter Objective Aid (no wind radii) Dialog
In this dialog, select the Technique name and DTG from the drop-down lists, then enter the latitude, longitude, and Max Wind (optional) for each tau. You must then run the Import New Objective Aid Data, Create Obj Aid Forecasts, and Run Objective Aidscommands in order to generate and display the appropriate forecast trackers in ATCF.
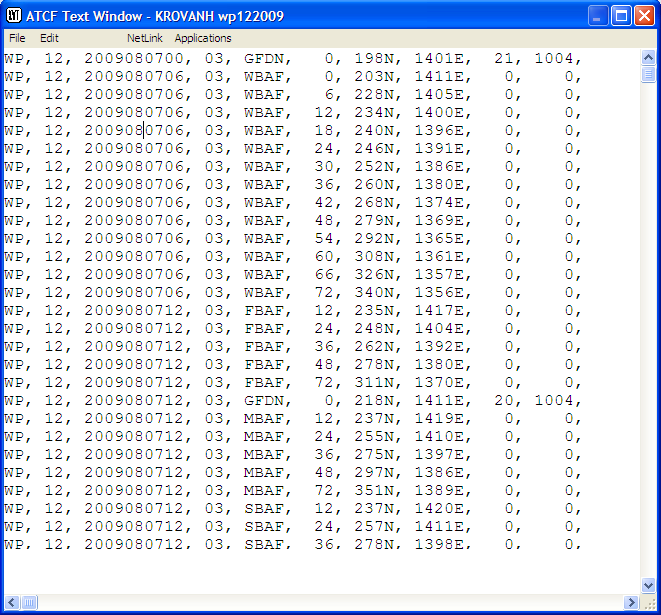
List Objective Aid Data… opens a text window displaying information on all objective aids entered for the current storm.
List Objective Aids Output
Edit Objective Aid Data… allows the selective modification of a particular objective aid in the event that aid contains incorrect data (hand entered incorrectly, data pull was corrupted, etc.). This command first opens the Choose a Storm dialog where you select the storm for which an objective aid is to be modified. Next the Obj Aid Record Edit dialog is displayed to allow you to select the particular DTG and objective aid that are to be modified.
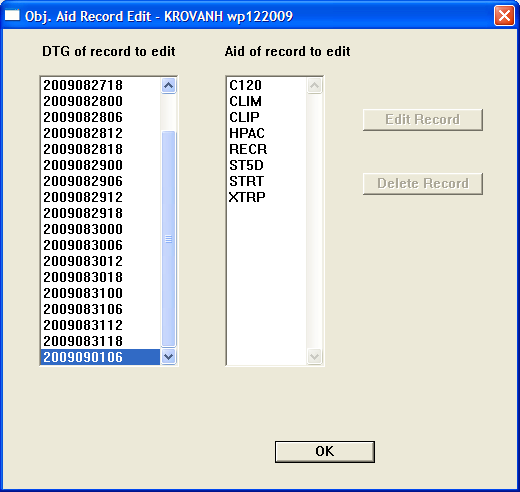
Obj. Aid Record Edit Dialog
Once the record to edit is selected, the appropriate Enter Objective Aid dialog (with or without wind radii) will be displayed to allow you to edit the record.
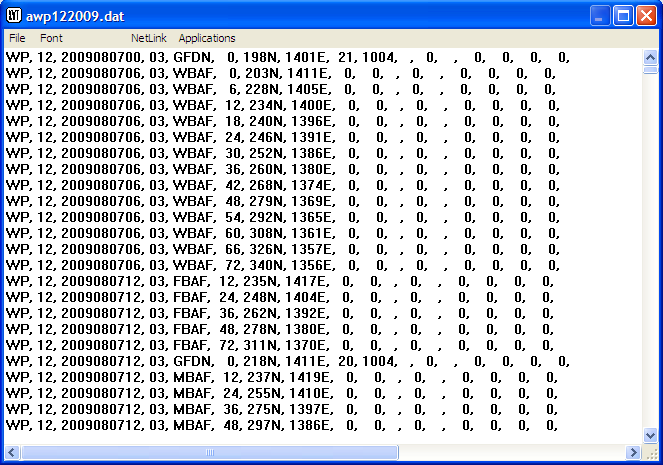
Objective Aids Editor… Opens an editable text window showing all of the currently entered objective aids for the selected storm. The information in this window must be edited carefully since the format is critical, e.g. don’t add any extra spaces and/or information. Highlight and change the information, or move the cursor to the data you want to change and carefully add and delete as necessary.
Objective Aids Editor
Objective Aid Speed Analysis… First presents the Choose a Storm dialog to allow you to select a storm to which the analysis will apply. Then it displays a the Compute Objective Aid Speeds dialog to allow you to select a profile, aid, and DTG for the calculations:
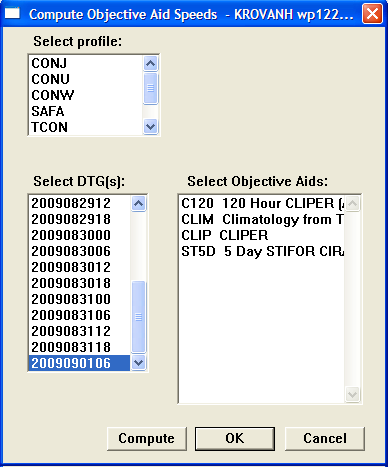
Compute Objective Aid Speeds Dialog
When you click on Compute or OK, ATCF generates a text file including the model run time (YYYYMMDDHH format), the tracker abbreviation (AVNI, NGPI, etc), the present (last 6 hours) along track speed and direction, and the forecast (for that particular aid) along track speed and direction for the 12, 24, 36, 48, 72, 96, and 120 hour forecast positions. This is the vector direction and speed only; no position information is presented in this text file.
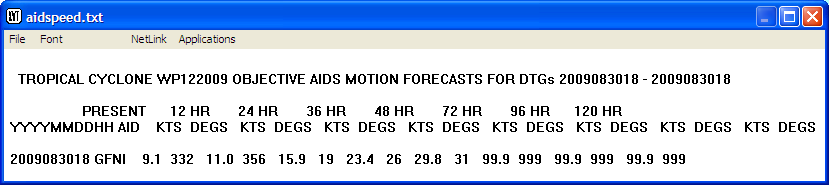
Objective Aid Speed Analysis Output
Import New Objective Aid Data is used prior to Create Obj Aid Forecasts to pull in the latest objective aids, including those entered manually.
Inventory Objective Aid Data… first opens the Inventory Objective Aids dialog to allow you to select the profile, DTG, and particular objective aid to inventory:
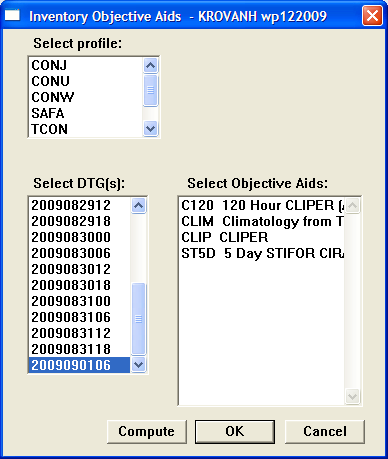
Inventory Objective Aids Dialog
Once a profile, DTG, and Aid are selected, clicking OK or Compute will conduct an inventory of data available for that aid at that DTG, and present the results in a text window:
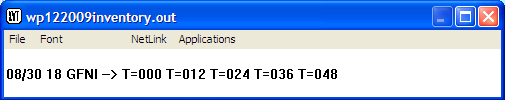
Inventory Objective Aid Data Output
Browse Aid Messages Directory… is not commonly used. It opens a dialog in which you select a storm number and the directory to search, then displays any messages found.
Graph Aid Intensity vs Time… first opens a selection dialog in which you select the DTG and aids to display in the graph:
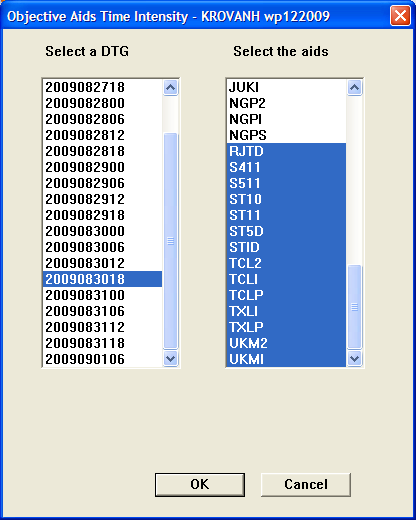
Objective Aids Time Intensity Dialog
Once you have made a selection, the selected aid forecasts will be plotted on a graph of intensity versus time:
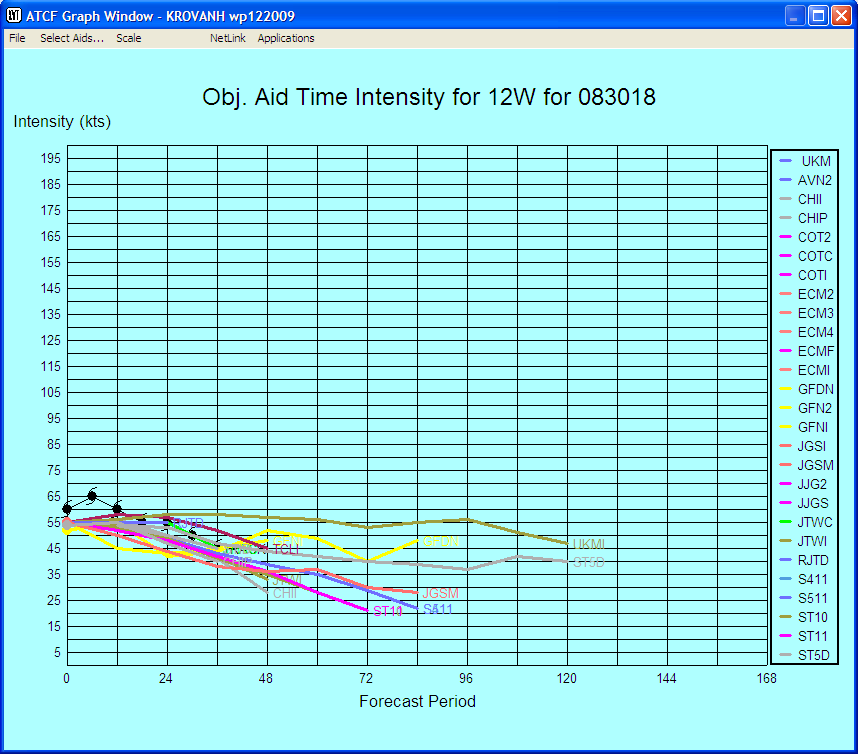
Objective Aid Time Intensity Graph
In this graph window, you can use the Select Aids… item in the menu bar to turn on and off the display of individual aids. You can also use the Scale option to select the maximum intensity displayed; this allows better definition for lower wind speeds.
Graph Aid Wind Radii vs Time… first presents the Objective Aid Time Intensity dialog (see above) to allow selection of a DTG and aids to graph (only those aids that generate wind radii will be shown in this case). It then presents a plot of aid wind radii versus time:
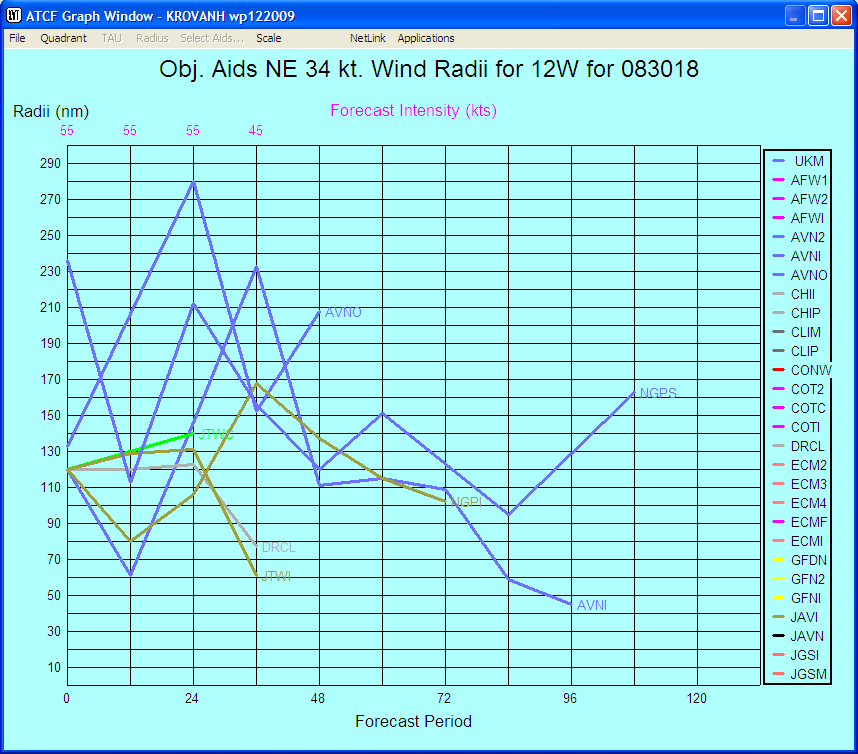
Wind Radii vs Time Graph
You can use the Quadrant selection in the menu bar to select the quadrant for which wind radii are displayed. The 4-panel display option under this menu shows wind radii for all four quadrants in one display, as shown below. The Scale menu item allows you to select the maximum wind radius that will be graphed. The TAU menu item allows you to select the tau for which wind radii are displayed. The Select Aids… selection lets you choose which aids are displayed.
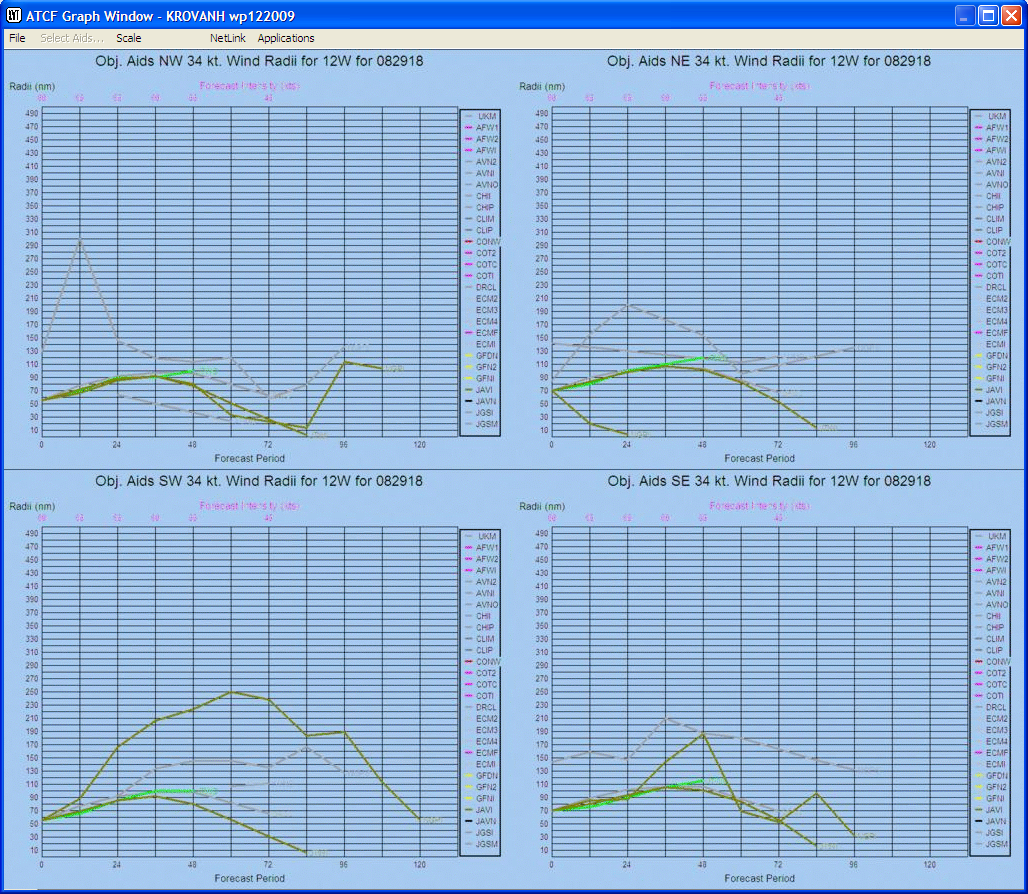
Wind Radii vs Time Graph (4-Panel)
Specify techlist file… presents a dialog to select a techlist file. This file contains a list of all of the available objective aids (including JTWC and Foreign forecast centers). Each line of data contains info for an objective aid. The column titled TECH is the four digit objective aid name. Following the objective aid name there is a column of 1's and 0's (1 = on, 0 = off). This column is the ERRORS column, it determines which aids are used in the Triangle Tables. The COLOR column determines what color is used to display the objective aid. See the color table in the "Change Colors" option. The DEFAULTS column controls which objective aids are the display defaults for "Display Objective Aids". The INT_DEFS, intensity defaults, are used for the "Intensity Guidance" box of the "Forecast Intensity" dialog. The RADII-DEFS, forecast wind radii defaults, are used for the "Wind Radii Guidance" box of the "Forecast Wind Radii" dialog. If there is a name in the LONG-NAME column then this name will be used when displaying the objective aid on the map. A LONG-NAME may be up to 10 digits.
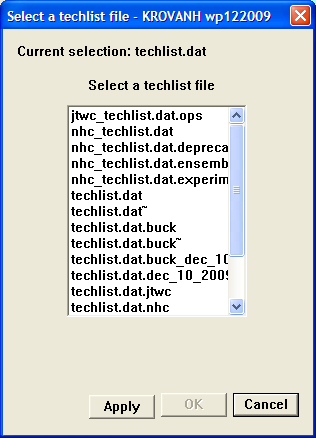
Select a techlist file Dialog
Check Objective Aid Data… generates a text file with a list of errors found in the objective aids data file.
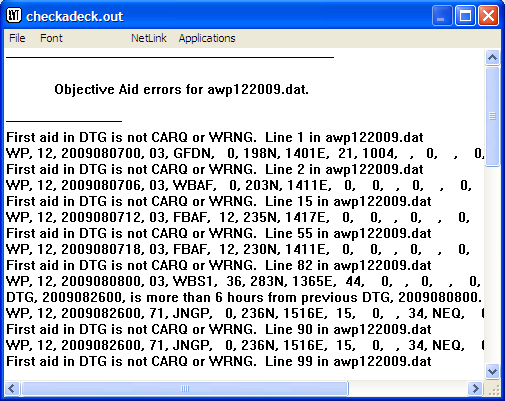
Check Objective Aids Data Output
The Fields menu contains options to display the observations and gridded fields used in preparation of the streamline and surface charts.
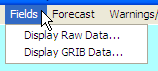
Fields Menu
Display Raw Data… opens the Choose Data Types dialog shown below.
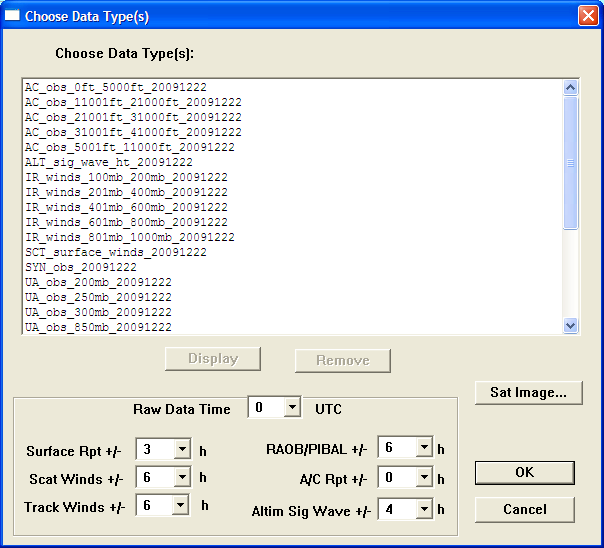
Choose Data Type(s) Dialog
In the main list window, you can select the types of data to display. To select a single data type, click on it to highlight it. To select a continuous range, click the first item, then hold the Shift key down and click the last item – the entire range will be highlighted. To select a group of items that is not continuous, click the first item, then hold down the Ctrl key and click each of the other items to be displayed – the selected items will be highlighted. Once selections have been made, click Display to show them in the map window. The Remove button is used to remove the selected items from the display.
The list boxes below allow you to select the time range of the data to be displayed for each data type, and the base time.
The Sat Image… button opens the Image Overlay dialog to allow you to select a satellite image to overlay on the map display. Only images that overlap the current map will be displayed.
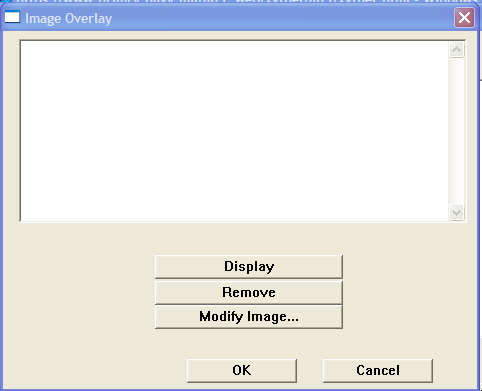
Image Overlay Dialog
Display GRIB Data… opens the Choose Data Type(s) dialog with gridded data types displayed. See above for the instructions for using this dialog.
JTWC ESOP02 specifies the following fields for use in developing the charts:
The Forecast menu contains tools to assist the TC forecaster in preparing the forecast.
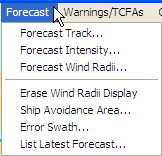
Forecast Menu
Forecast Track... opens the Forecast Track Dialog, seen below.
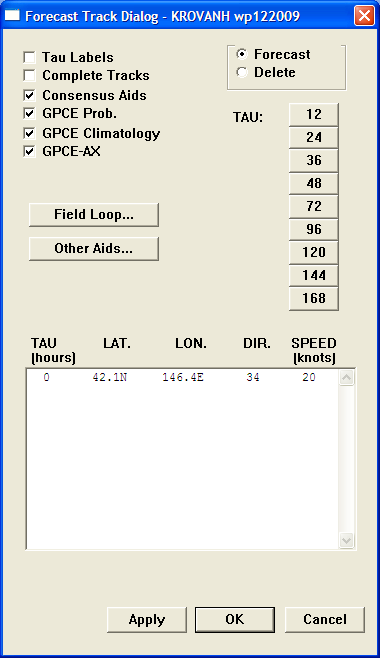
Forecast Track Dialog
This dialog is used to control the map display to aid the forecaster in developing the storm track.
Tau Labels toggles the display of tau labels on the objective aids forecasts.
Complete Tracks displays the full range of forecast positions from each objective aid selected.
Consensus Aids toggles the display of all consensus aids (GPCE, GPCE Climatology, and GCPE-AX).
GCPE Prob toggles the display of the Goerss Probability Consensus Error (GPCE) product.
GPCE Climatology toggles display of the climatological GPCE error product.
GPCE-AX toggles the display of the GPCE Along- and Cross-Track product.
Forecast and Delete radio buttons toggle whether the dialog is being used to create a forecast or delete one.
TAU Buttons control the time range of the objective aids displayed and permit entry of a new forecast position by clicking on the map. Clicking the 12 button, for example, shows the objective aids only out to tau 12, and presents a prompt to click on the map to enter the tau 12 forecast position (see below).

Map Window With Prompt to Enter TAU 12 Position
Field Loop… displays the Two Panel Loop Fields dialog shown below. This dialog selects a loop profile to display.
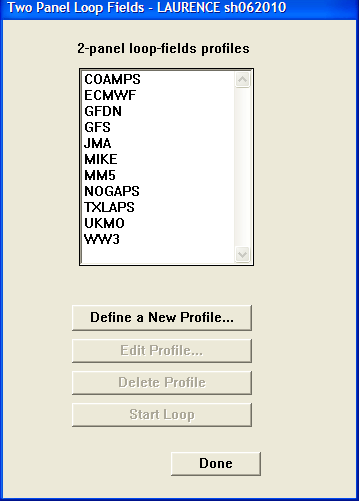
Two Panel Loop Fields Dialog
After a selection is made and the Start Loop button clicked, the Two Panel Loop display appears (note: this may take some time).
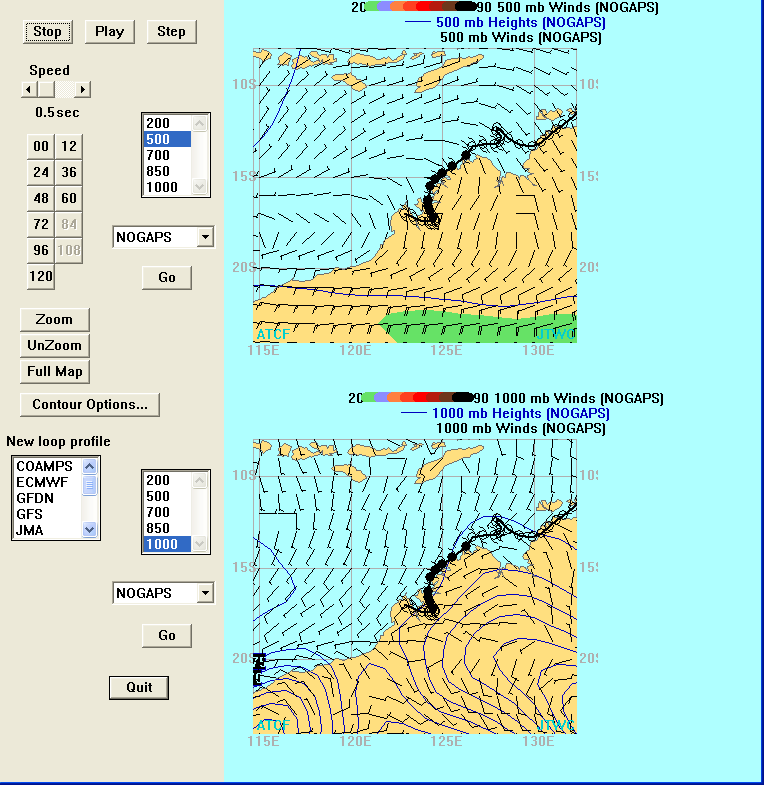
Two Panel Loop Display
At the top are controls to Stop, Play, and Step the loop display and adjust the looping speed. You can also choose the levels and models displayed in each of the looping panels, Zoom and UnZoom the display maps or return the the Full Map. You can also use the list box provided to select a New loop profile.
Other Aids opens a selection dialog to allow display of additional aids in the map display.
When a forecast position has been entered (see Item 8 above) it will appear in the display at the bottom of the Forecast Track dialog.
Forecast Intensity… displays the Forecast Intensity dialog shown below.
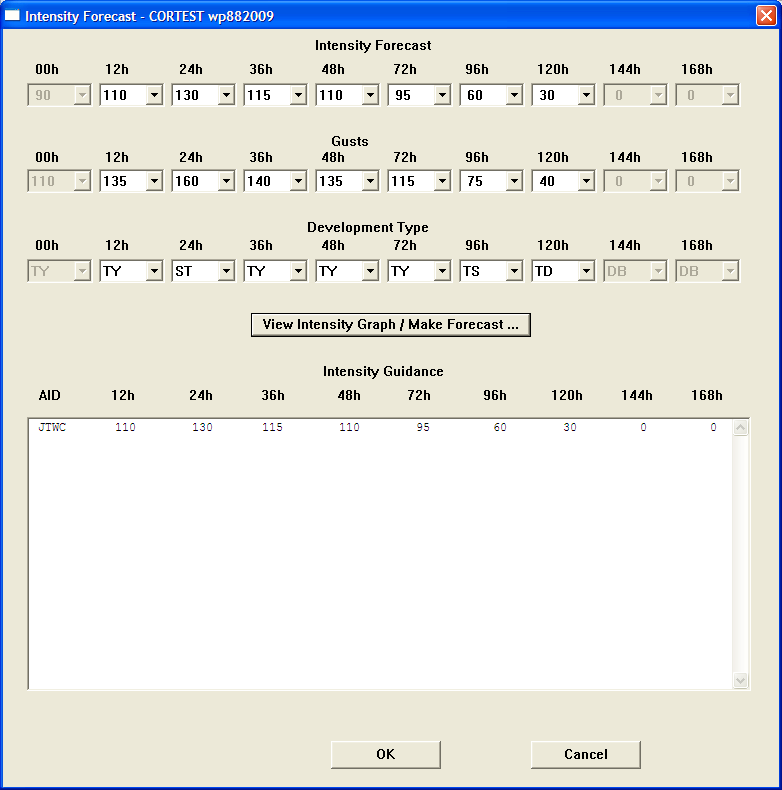
Intensity Forecast Dialog
This dialog is relatively simple to use, with drop down menus for the intensity. You don’t need to change the gusts – these are set and based on the maximum sustained wind. The available intensity guidance is displayed at the bottom for your consideration.
The View Intensity Graph/Make Forecast button opens the Objective Aids Time Intensity dialog to allow you to select a DTG and aid(s) to graph, then displays the Objective Aid Time Intensity graph.
Objective Aids Time Intensity Dialog
Objective Aids Time Intensity Graph
Forecast Wind Radii… displays the Forecast Wind Radii dialog:
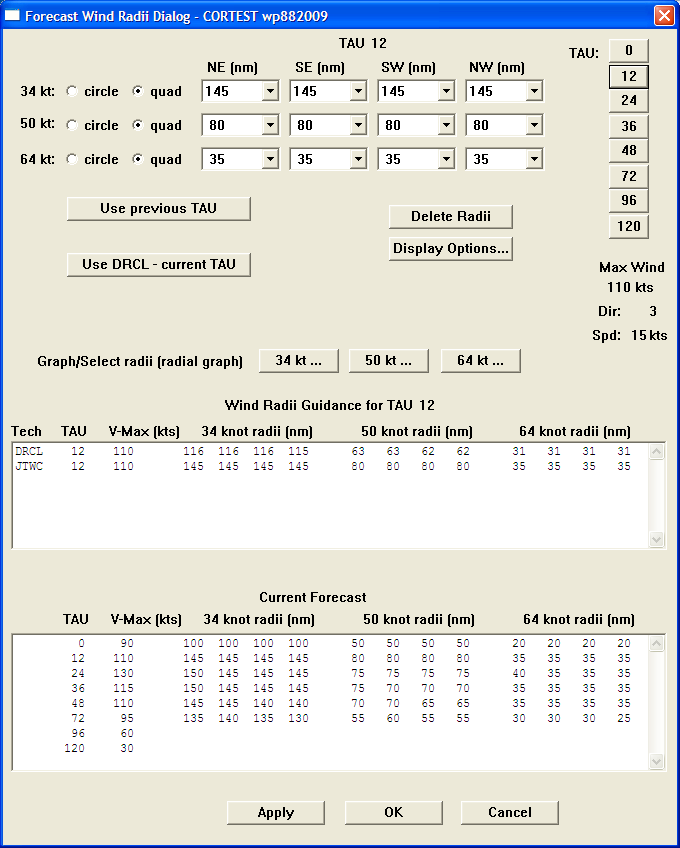
Forecast Wind Radii Dialog
The text box at the bottom shows the current forecast. The one above it presents available guidance, such as the DeMaria Radii CLIPER (DRCL) radii. You can use the buttons and pull-down boxes at the top to select the TAU, and for each of the radii specify whether the forecast is by complete circle or quadrant, and select the radii. The Display Options button lets you choose what will be displayed in the Storm Window. The Use DRCL – Current TAU button allows you to view the DRCL radii for guidance. The Use Previous TAU button populates the current TAU with the values from the previous TAU (e.g. repeat the TAU 24 values as the TAU 36 forecast). The Delete Radii button clears the values from the current TAU.
You can also use the Graph/Select radii (radial graph) button for the appropriate TAU to view guidance and select wind radii graphically. Each of the buttons opens an interactive graph window like the one shown below. The arrow in the window shows the storm’s current direction and speed of movement. The dots show the forecast guidance (in the example, the DRCL radii). You can click in any quadrant to select the wind radius in that quadrant. The Menu Bar at the top contains selections for the quadrant, TAU, and radius being forecasted, and for the scale of the display. When you’ve completed your selections, open the File menu and select Exit. Your selections will then be displayed in the Forecast Wind Radius Dialog. Click on the OK button to exit.
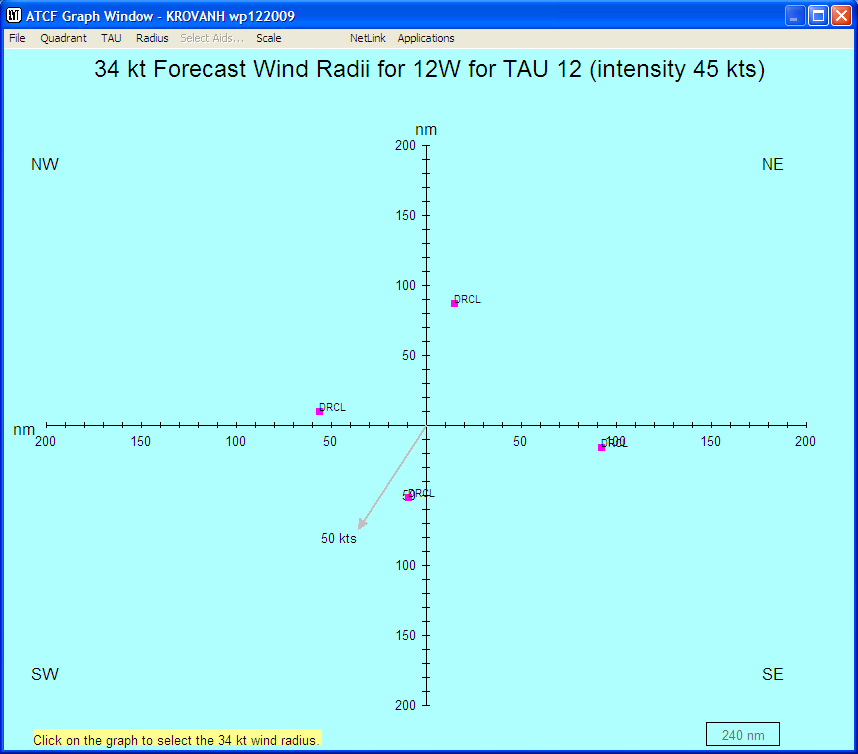
Graph/Select Wind Radii Display
Erase Wind Radii Display removes any displayed wind radii from the map display.
Ship Avoidance Area… displays the Ship Avoidance Area Dialog:
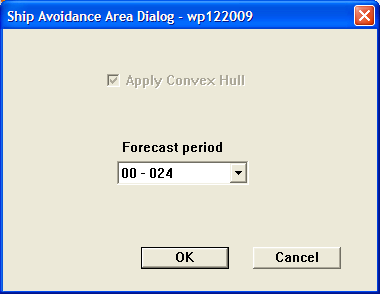
Ship Avoidance Area Dialog
Normally the default settings are used – just click on the OK button to produce the forecasts. Nothing is displayed on the map as a result of this action, which simply causes the area to be calculated and stored. The Cancel button exits without calculating the ship avoidance area.
Error Swath… displays the Error Swath Dialog:
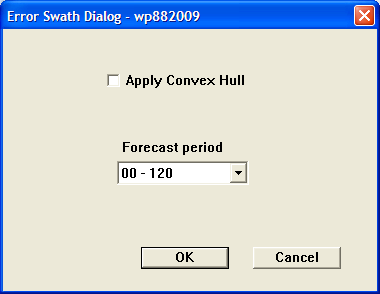
Error Swath Dialog
The default settings are normally used – just click on the OK button to produce the forecasts. The Apply Convex Hull box should normally be unchecked – this is to be checked only if the error swath does not appear to be representative of the error radius of the forecasts. This action simply calculates and stores the error swath for future use; nothing is displayed on the screen. The Cancel button exits with no further action.
List Latest Forecast… opens a text display window showing the latest forecast:
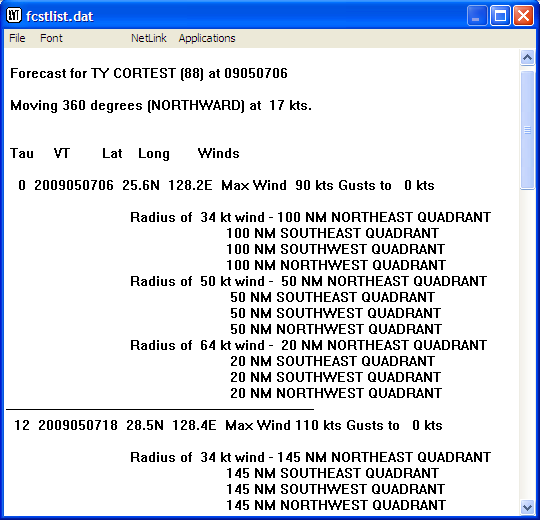
List Latest Forecast Output
This is not an editable window. Click on File in the window’s Menu Bar and select Exit to close the window once you have viewed the forecast.
The Warnings/TCFAs menu contains actions used in creating forecasts and TCFAs.
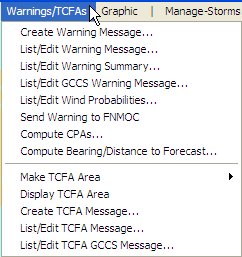
Warnings/TCFAs Menu
Create Warning Message… is the first option selected when creating a warning. The warning message serves as a central focus for the warning creation process. Selecting this option opens the Create a Warning Message dialog:
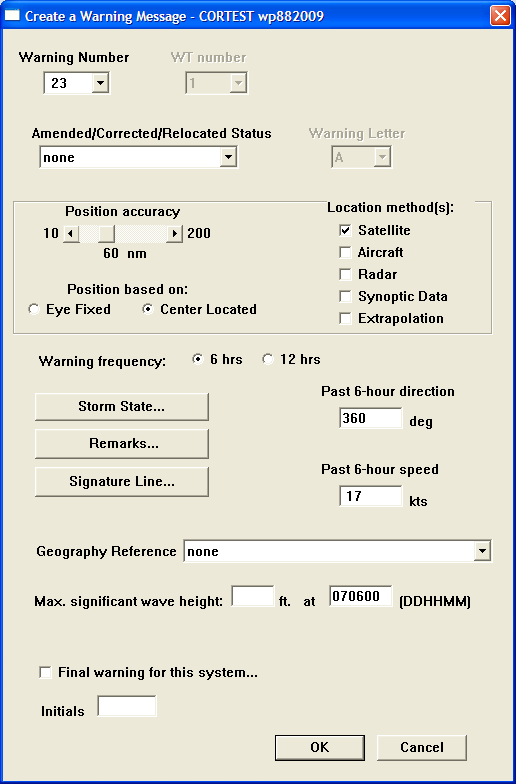
Create a Warning Message Dialog
Warning Number is the next sequential warning number for the current storm.
Amended/Corrected/Relocated Status should be selected as appropriate. Use none if this is an original warning.
Position Accuracy is obtained from the Satellite Analyst, as is the remainder of the information in the location section of the form, i.e. Position Based On and Location method(s).
Warning frequency defaults to 6 hours.
Storm State… opens the storm state dialog:
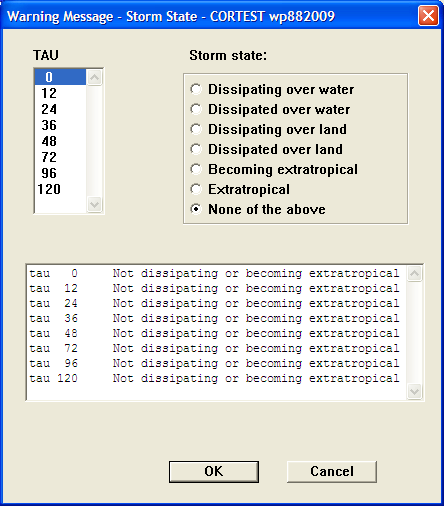
Storm State Dialog
Select the TAU from the list, then select the Storm state for that TAU. Repeat for all TAUS as required. The box at the bottom shows the results. Click the OK button to save the results and close the dialog; Cancel closes the dialog without any other action.
Remarks… opens a text window that may be used to enter remarks. Remarks are not required.
Signature Line… opens the Warning Message Signature Line dialog:
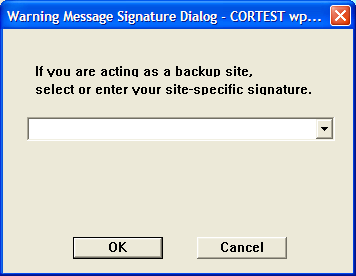
Warning Message Signature Dialog
This may be used to enter or select your site-specific signature.
Past 6-hour direction and Past 6-hour speed are used to enter the direction and speed of movement of the storm since the last warning.
Geography Reference has a drop-down menu from which you can select points of geography to which to reference the storm’s current position.
Max significant Wave Height is obtained from the FDO, Winds and Waves Forecaster.
Final Warning for this system must be checked if this is the final warning that will be issued for the current storm.
Initials entry is not applicable for NHC/CPHC warnings.
Click OK once you are done entering data for the warning message. A confirmation dialog will open asking whether you want to send the warning summary to FNMOC Monterey, CA. Click Yes.
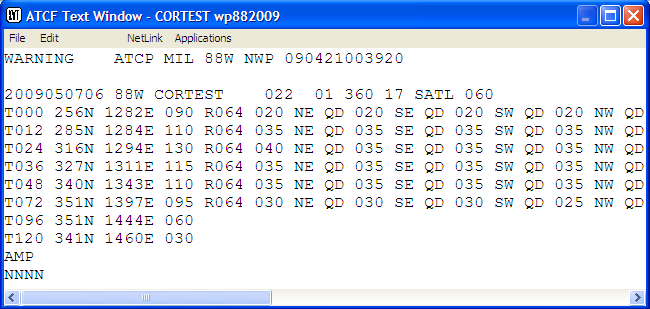
List/Edit Warning Message… opens the warning message in an editable text window:
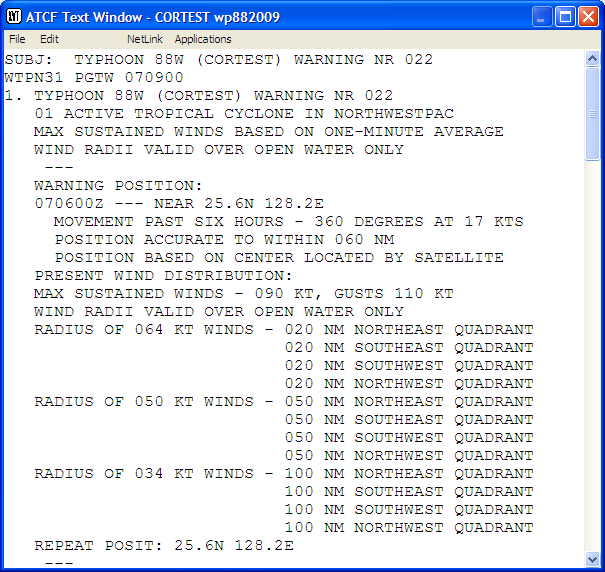
List/Edit Warning Message Window
The File menu in this window provides functions to Print the message, Print Landscape (print in landscape format), Save, Save As, and Exit. The Save and Save As functions open a standard Save File dialog allowing you to enter the filename and location.
The Edit menu offers Cut, Copy, Paste, and Clear functions to aid in editing the message.
List/Edit Warning Summary… opens the warning summary in an editable text window:
List/Edit Warning Summary Window
The menus for this window are the same as those for the List/Edit Warning Message window above.
List/Edit GCCS Warning Message… opens the warning message in the format that is sent to the Global Command and Control System (GCCS) in an editable text window. Window menus are the same as for the List/Edit Warning Message window (item B above)
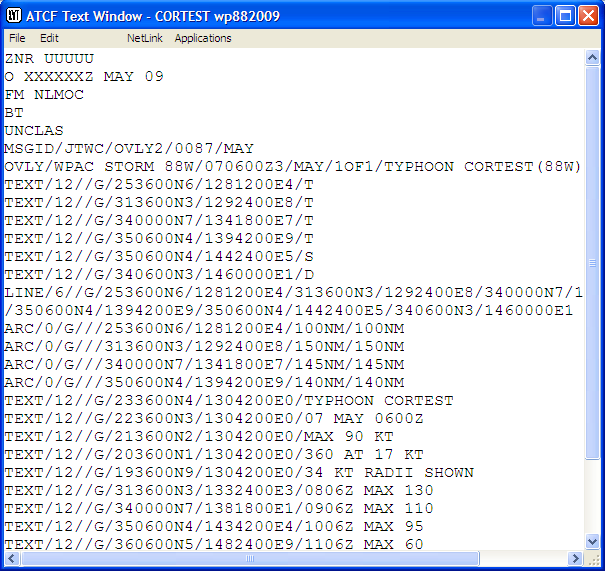
List/Edit GCCS Warning Message Window
List/Edit Wind Probabilities… opens the wind probabilities message associated with the current warning in an editable text window:
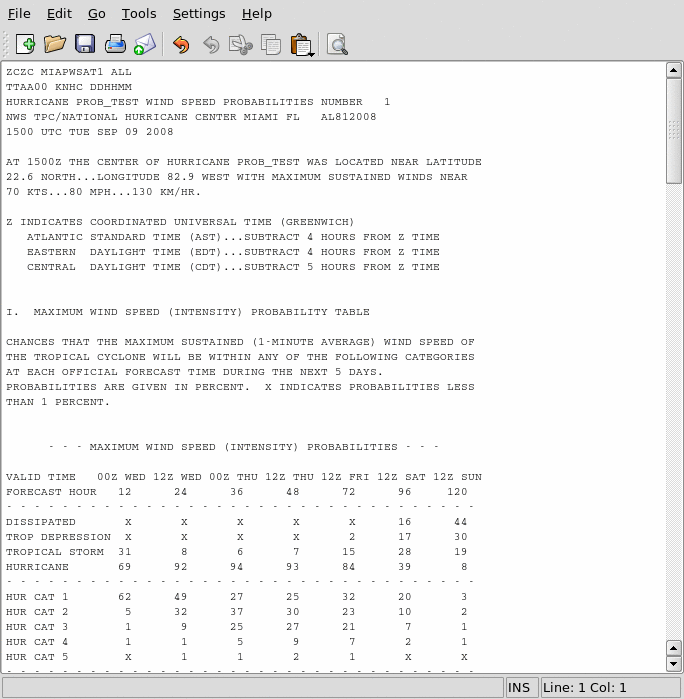
List/Edit Wind Probabilities Window
Send Warning to FNMOC sends the current warning to FNMOC.
Compute CPAs opens the CPAs dialog, in which you can select the Units for the CPA distance by selecting the correct radio button, specify the Maximum CPA Distance (CPAs greater than this will not be included in the output), select geographic LocationNames relative to which CPAs will be calculated, or specify a Latitude and Longitude to which to calculate a CPA. Typically all you need to do is click on the Use Maximum Distance button to accept the defaults. The CPAs file will then be displayed in an editable text window. This information will be contained in the CPAs label in the Warning Graphic, so you may need to edit it to keep the label a reasonable size. When done, close the edit window and click on the Done button in the CPAs dialog to close it.
CPAs Dialog
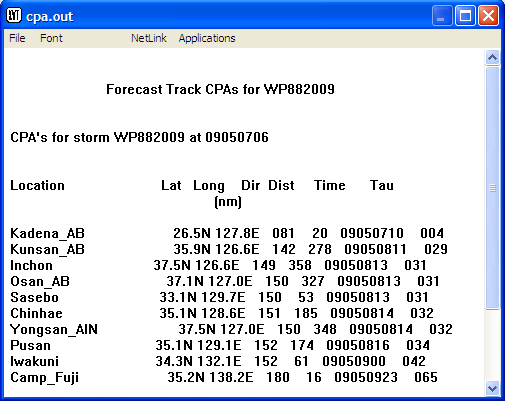
CPAs File Edit/Display Window
Compute Bearing/Distance to Forecast… opens the Bearing/Distance to Forecast dialog. This is similar to the CPAs dialog above, with the addition of a Forecast Period list box in which you can select one or more forecast periods for which to calculate bearings/distances to selected geographic locations. To select a continuous range of Forecast Periods, click the first, hold down the Shift key, and click on the last forecast period in the range. To select multiple forecast periods that are not a continuous series, click the first, and hold down the Ctrl key while clicking each of the others. Selected choices will be highlighted.
As with the CPAs window, you normally need only click on the Use Maximum Distance button to display the bearing/distance file in its editable text window, edit the list as desired and close the text window, then click Done in the dialog.
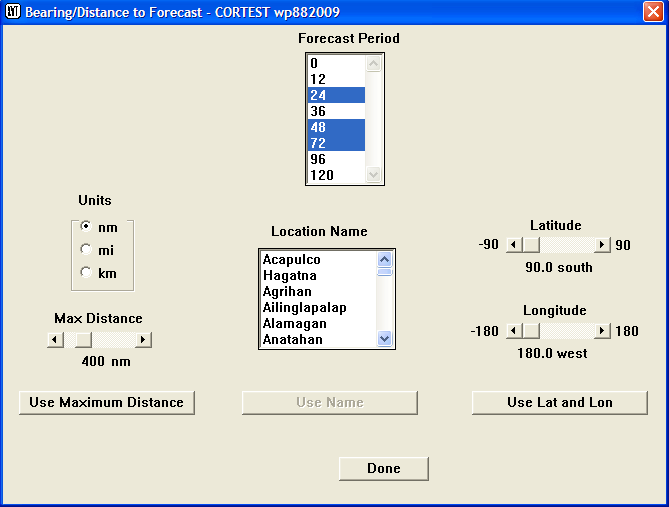
Bearing/Distance to Forecast Dialog
Bearing/Distance to Forecast Text Edit Window
Make TCFA Area opens a flyout menu giving the choice of either a Box or a Circle:
Box… opens the TCFA Box Creation dialog. Use the slider at the bottom to set the distance from the center line to the edge of the box. Then click on the map, where a prompt will direct you to click and drag the mouse to designate the center line of the box. When you release the mouse, the information at the top of the dialog will be filled in. Click the OK button to close the dialog.
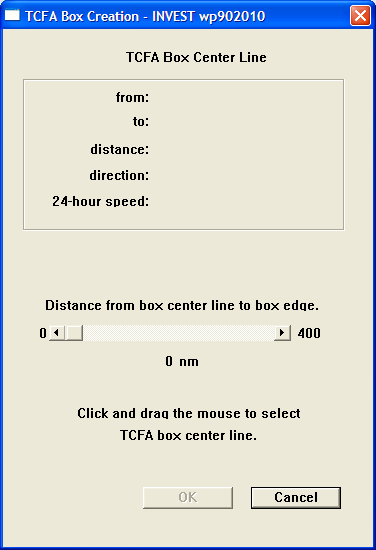
TCFA Box Creation Dialog
Circle… opens the TCFA Circle Creation Dialog:
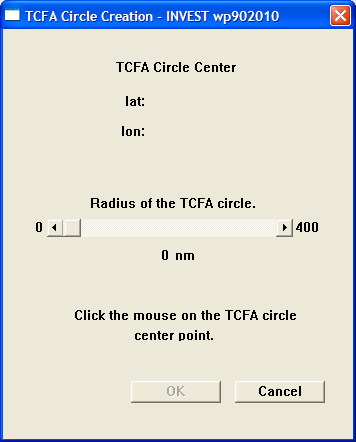
TCFA Circle Creation Dialog
In the dialog, set the Radius of the TCFA circle, and then click on the map to establish the center point. The information at the top of the dialog will then be filled in. Click the OK button to exit the dialog.
Display TCFA Area is used to display the TCFA area when it is not already shown on the map. This is not often used, as the TCFA area will be displayed when it is created.
Create TCFA Message… opens the Create a TCFA Message dialog:
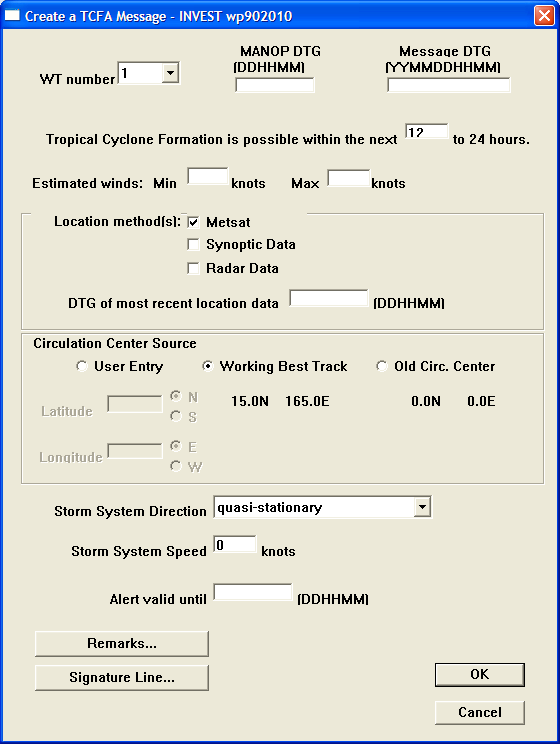
Create a TCFA Message Dialog
WT Number should be filled in automatically; otherwise use the next available number in sequence.
MANOP DTG to the nearest ½ hour.
Message DTG: MANOP DTG – 9 minutes.
Estimated Winds: Ensure you don’t make winds too high (e.g. 20 to 25 knots would merit a warning vice a TCFA; typically winds for a TCFA are 15-20 knots in WESTPAC and 25-30 knots elsewhere.)
Location method(s) : Check one or more of the methods and then enter the DTG of most recent location data as specified.
Circulation Center Source: Indicate how the circulation center was determined.
Storm System Direction: Choose the appropriate value from the drop-down list.
Storm System Speed: Enter the appropriate value.
Alert valid until: MANOP DTG + 24 hours.
Remarks: Enter any remarks needed (see SOP 15 for further guidance).
Signature Line…: Enter the TDO’s signature.
Click OK to exit.
List/Edit TCFA Message… opens the TCFA message in an editable text window.
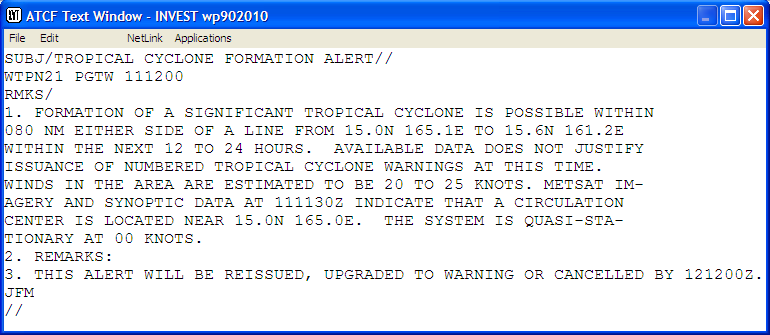
List/Edit TCFA Message Window
The File menu in this window provides functions to Print the message, Print Landscape (print in landscape format), Save, Save As, and Exit. The Save and Save As functions open a standard Save File dialog allowing you to enter the filename and location.
The Edit menu offers Cut, Copy, Paste, and Clear functions to aid in editing the message.
List/Edit TCFA GCCS Message… opens the TCFA message in the format used by GCCS in an editable text window. The window controls are as shown above.
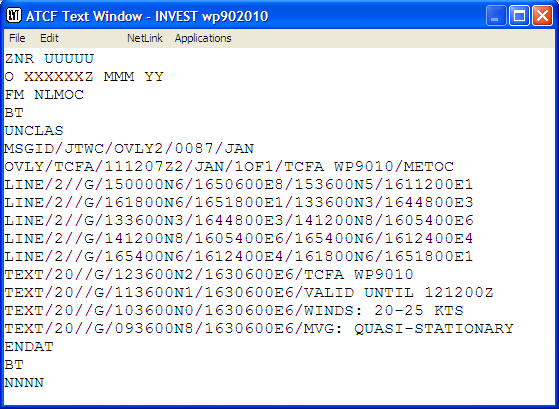
List/Edit TCFA GCCS Message Window
The Graphic menu brings together functions related to the creation and annotation of warning, ship avoidance area, and error swath graphics for tropical cyclones, and TCFA graphics.
Snap to warning area automatically zooms in the map window to cover the warning area.
Create warning graphic provides an automated method for creating and labeling the warning graphic, combining the functions of displaying and labeling the forecast positions, displaying wind radii, and creating the warning graphic labels. This function should be used with some degree of caution, however, because you relinquish control of these functions and settle for the defaults, which may produce a graphic that is difficult to read. In relatively simple cases, however, it can save a lot of time.
Display Avoidance Area opens the Ship Avoidance Area dialog to allow you to adjust the parameters of the display. In most cases, you only need to click on the OK button to display the ship avoidance area on the map. The Forecast Period list box lets you select the period for which the area will be displayed.
Ship Avoidance Area Dialog
Display Error Swath displays the error swath for the forecast on the map. Note that you must first create the error swath (Forecast menu, Error Swath…) before it can be displayed.
Display Forecast Track displays the forecast positions and track in the map window.
Display Forecast Track and Wind Radii displays the forecast positions and track plus the forecast wind radii for each forecast position.
Forecast Wind Radii Options… opens the Forecast Wind Radii Options dialog:
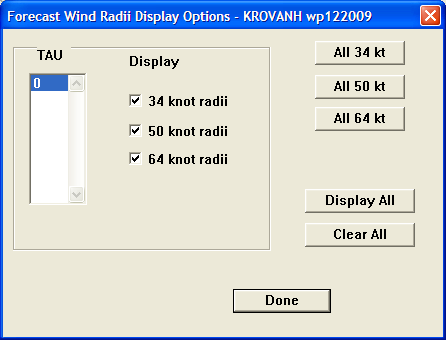
Forecast Wind Radii Options Dialog
TAU lets you specify one or more TAUs to which the selected options will apply.
The check boxes under Display allow you to select the wind radii to be displayed.
The All… buttons are used to display the specified wind radii for all TAUs.
The Display All button displays all radii for all TAUs (this is the default).
The Clear All button deselects all wind radii, so that they will not be displayed.
Click the Done button when finished to display the selected wind radii in the map window.
Display Cumulative Wind Probs opens a flyout menu that allows you to select the particular wind probabilities of interest. If you are creating the wind probabilities graphic, select 34kt as this will show the largest swath and define the area the graphic will cover.
After selecting the wind probability of interest, a GRIB Data dialog will open to allow you to select the data from which to plot the wind probabilities:
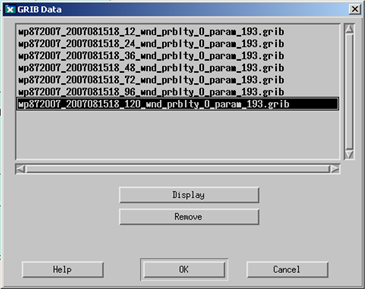
GRIB Data Dialog
Select the 120_wnd_prblty file; again, this provides the largest swath and is used to ensure that the window is large enough.
Use the zoom functions to re-size the window to a rectangular box covering the entire wind probability swath. Then repeat the procedure above until all of the desired wind probabilities are displayed.
Save 34, 50, 64-kt Wind Probs Graphic to File opens a Save File dialog that allows you to save the files to the NIPRnet and SIPRnet web pages. File naming and location conventions are established by each organization.
Chart and Storm Titles opens the Storm Title/Chart Title dialog that allows you to select geographic locations to be shown with titles, and to place the titles on the map:
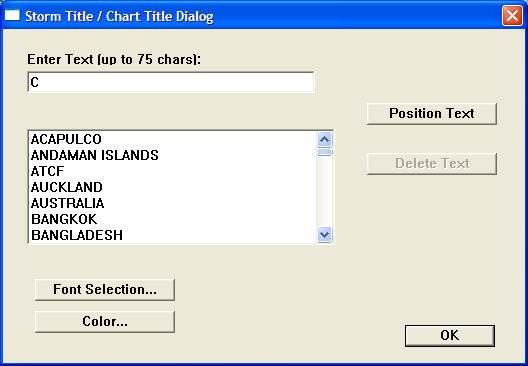
Storm Title/Chart Title Dialog
Select a location from the list. You can use the Font Selection… and Color… buttons to bring up dialogs that allow you to change the font and color. When the selections are made, click Position Text, which gives the focus to the map window, where you can click to position the upper left corner of the label.
You may also enter freeform text using this dialog by typing the text in the entry box at the top, and then following the same procedures to select the font and color and position the text. This is used, for example, to place the “C” on a TCFA graphic.
The Delete Text button deletes the currently selected text. The OK button is used to exit the dialog when you are finished.
Logo/Thumbnail… is used to place a logo or thumbnail (typically the logo for the Center creating the graphic) on the map display. Selecting this opens the Logo/Thumbnail dialog:
![]()
Logo/Thumbnail Dialog
Click on the Display an Image button to open a file selection dialog that allows you to select the image to be added. When you have selected an image, control will be transferred to the map window, where you can click to select the location for the upper left corner of the image.
The Position button allows you to re-position the logo after it is initially placed. Control is transferred to the map window, where you can click and hold the mouse button on the logo and drag it to the new position, then release the mouse button to re-position it.
The Size button allows you to re-size the logo after it is initially placed. Control is transferred to the map window, where you can click on a corner of the logo and drag a “rubber band” outline to re-size the logo.
The Displayed Images list box shows the images currently displayed on the map. To remove a particular image, highlight it in the list and then click on the Remove button.
The OK button exits the dialog.
Image Overlay… allows you to overlay a geographically-located image (for example, a satellite image) on the map display. Selecting this option opens the Image Overlay dialog:
Image Overlay Dialog
The list box at the top shows the available images and allows you to select one for display.
The Display button overlays the selected image on the map display.
The Remove button removes the selected image from the map display.
The Modify Image… button is currently inactive. This utility is being worked on and is also not available in the web version.
The OK button exits the dialog.
The Cancel button exits the dialog without making any changes to the display.
Label Forecast… is used to label the forecast positions. Selecting this function opens the Forecast Label dialog:
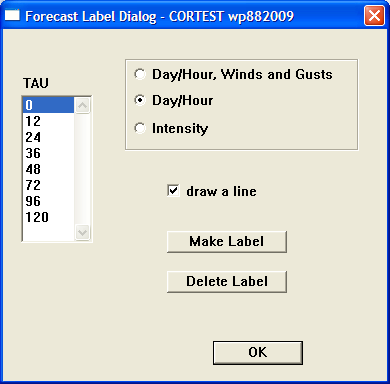
Forecast Label Dialog
TAU is used to select the TAU for which to create a label.
The radio buttons at the top select what is to be included in the label. The default is Day/Hour.
The draw a line checkbox is selected if you want a line to be drawn between the label and the forecast position.
The Make Label button is used to create the label itself. Control is transferred to the map window, where a rubber-band line connects the cursor to the forecast position. You need only move the cursor to the desired position for the left end of the label and click on the map to position the label.
The Delete Label button can be used to delete the label for the selected TAU.
The OK button exits the dialog – you should use this only after creating the labels for all desired TAUs.
TCFA Label… is used to create the label for the TCFA graphic. This option opens the TCFA Label dialog:
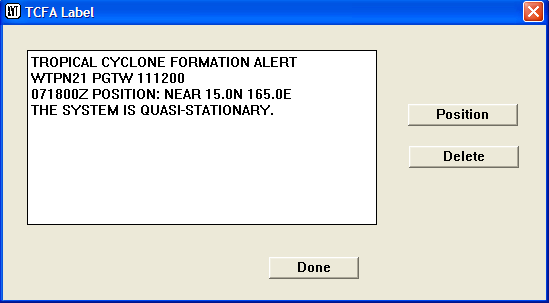
TCFA Label Dialog
The text box on the left side shows what will appear in the label. This text is editable – just click within the box and make any desired edits.
The Position button transfers control to the map window, where you can click on the map to position the upper left corner of the label.
The Delete button deletes the label from the map window.
The Done button exits the dialog.
Warning Label… is used to create the warning label for the tropical cyclone warning graphic. This option opens the Warning Label Dialog:
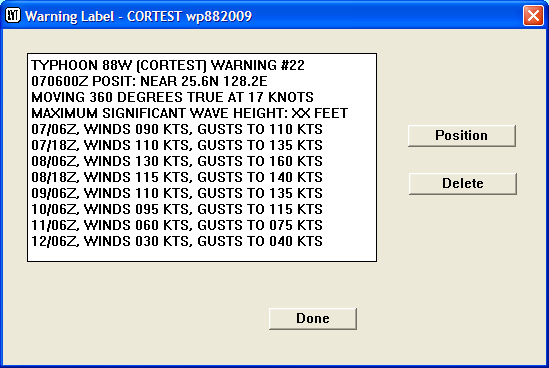
Warning Label Dialog
The text box on the left side shows what will appear in the label. This text is editable – just click within the box and make any desired edits.
The Position button transfers control to the map window, where you can click on the map to position the upper left corner of the label.
The Delete button deletes the label from the map window.
The Done button exits the dialog.
Note that this function is performed automatically by the Create warning graphic option; however, using Warning Label… gives you additional control and allows you to edit the label.
Warning Legend… is used to place the legend on the warning graphic. Note that this function is also performed automatically as part of the Create warning graphic function; however, using Warning Legend… gives you additional control over the placement of the legend. Choosing this option opens the Warning Legend dialog:
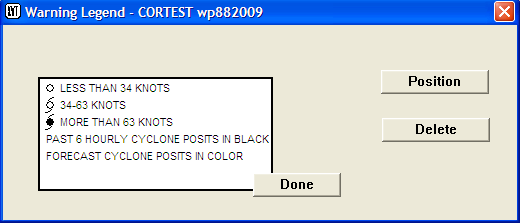
Warning Legend Dialog
The Position button transfers control to the map window, where you can click on the map to position the upper left corner of the label.
The Delete button deletes the label from the map window.
The Done button exits the dialog.
CPA Label… is used to edit the CPA label and place it on the warning graphic. Note that this function is performed automatically by the Create warning graphic option; however, using CPA Label… gives you additional control and allows you to edit the label. Choosing this option opens the CPA Label dialog:
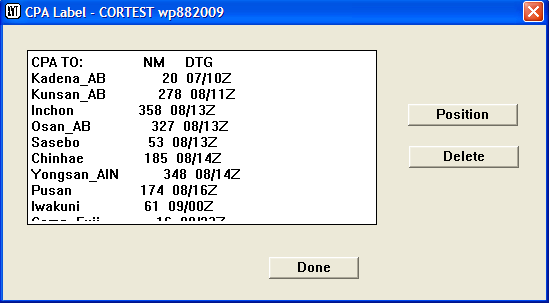
CPA Label Dialog
The text box on the left side shows the computed CPAs. This text is editable; just click within the box and edit as necessary. Some editing may be needed to ensure that the label fits well within the warning graphic.
The Position button transfers control to the map window, where you can click on the map to position the upper left corner of the label.
The Delete button deletes the label from the map window.
The Done button exits the dialog.
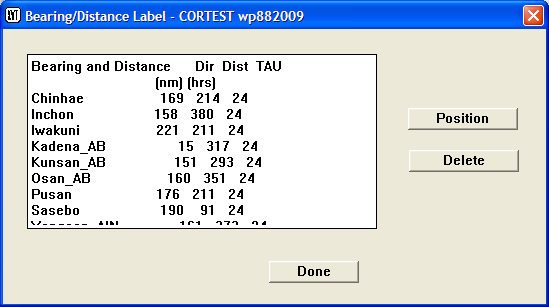
Bearing/Distance Label… is used to place a label in the warning graphic that shows the bearing and distance of the forecast positions to nearby geographic locations. Note that this function is performed automatically by the Create warning graphic option; however, using Bearing/Distance Label… gives you additional control and allows you to edit the label. Choosing this option opens the Bearing/Distance Label dialog:
Bearing/Distance Label Dialog
The text box on the left side shows the computed bearings and distances. This text is editable; just click within the box and edit as necessary. Some editing may be needed to ensure that the label fits well within the warning graphic.
The Position button transfers control to the map window, where you can click on the map to position the upper left corner of the label.
The Delete button deletes the label from the map window.
The Done button exits the dialog.
Extra Right Margin expands the right margin of the map window (to the right of the map itself) to accommodate the warning, CPA, and bearing/distance labels and the warning legend. Note that this will happen automatically as required – if the right margin is expanded, this option will show a checkmark.
Combined Warning, CPA, and Bearing/Distance Label… can be used to place a single label that combines the warning, CPA, and bearing/distance labels. Note that this function is performed automatically by the Create warning graphic option; however, using Combined Warning, CPA, and Bearing/Distance Label… gives you additional control and allows you to edit the label. This option opens the Warning Label dialog (shown above).
The text box on the left side shows the warning label, with the CPA and Bearing/Distance labels appended at the end. This text is editable, and probably should be edited to ensure it fits within the graphic window.
The Position button transfers control to the map window, where you can click on the map to position the upper left corner of the label.
The Delete button deletes the label from the map window.
The Done button exits the dialog.
Range Rings and Warning Regions displays 180 nautical mile rings around selected geographic locations. The selection is a toggle; click once to toggle on (checked) and again to toggle off (unchecked). The resultant display is shown below.
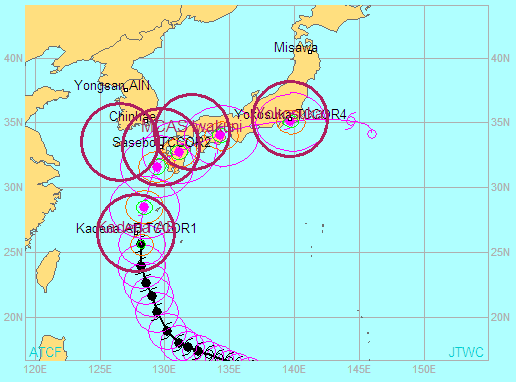
Range Rings Display
TC-COR Settings is an experimental product that displays the tropical cyclone conditions of readiness (TC-COR) for selected sites on the map display. This is another toggle; click once to toggle on (checked) and again to toggle off (unchecked). The display is shown below:
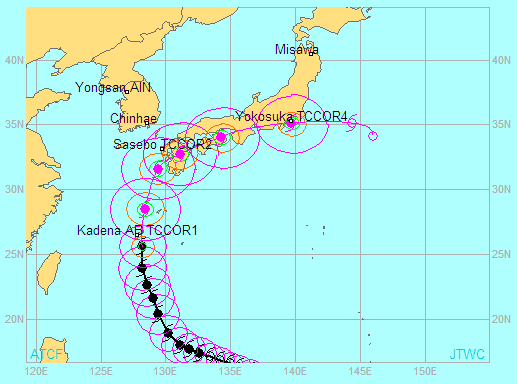
TC-COR Settings Display
Geography Labels is a toggle to turn on and off the display of geography labels.
Geography Labels With Dots turns on off a display of geography labels with location dots for more precise location.
Show Sidebar toggles the Sidebar on and off.
High Resolution Map displays the map in higher resolution. This is useful for areas where the only geography consists of small islands, but it may make the map very slow to render, or to refresh when there is a change. This option is not used for any standard products.
Extended Forecasts displays objective aids forecasts past TAU 120 as dashed lines.
The Manage-Storms menu contains options that are used in managing the storm index.
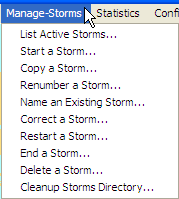
Manage-Storms Menu
List Active Storms… opens a selection dialog that allows you to choose a specific basin or all basins:
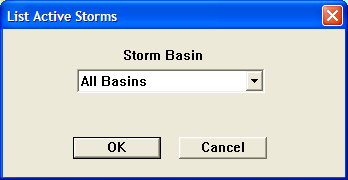
List Active Storms Dialog
When you make a selection from this dialog and click the OK button, the list of active storms for the selected basin(s) is displayed in a text window:
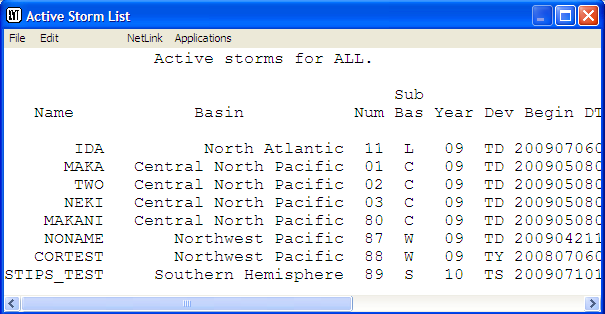
List Active Storms Output
The list shows all active storms (01-49), invests (90 series), training systems (50-79), and administrative/test systems (80-89). To close this window, open its File menu and select Exit.
Start a Storm… opens the Start a Storm dialog:
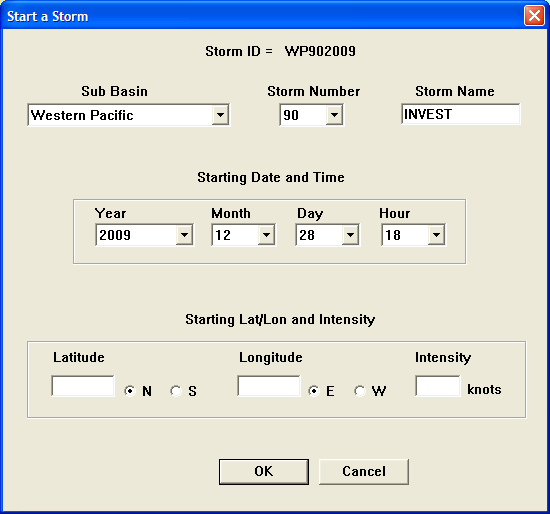
Start a Storm Dialog
This dialog allows you to input storm specific information. Typically, the SATOPS Analyst will start the storm as an invest; however, the TDO should understand the necessary steps below and may occasionally have to open an invest:
Select the appropriate basin from the Sub Basin list box.
Select the appropriate Storm Number.
The Starting Date and Time will automatically default to the closest hour.
Enter the Latitude, Longitude, and Intensity.
Click on the OK button when all fields are correctly entered.
Ensure that you use the correct storm number. Check the list for the last numbers used for each basin and then use the next available number. It is very important to enter the correct location and appropriate intensity since this will affect the FNMOC and NRL TC Pages.
Copy a Storm… is used to copy an existing storm and save it with a new storm number. It is absolutely critical that you use this function correctly – know what number you will be using before you copy it (usually it will be renumbered as an 80-series storm). To copy a storm:
When you select Copy a Storm... from the menu, the Storm Management – Copy a Storm dialog is displayed to allow you to select the storm to be copied:
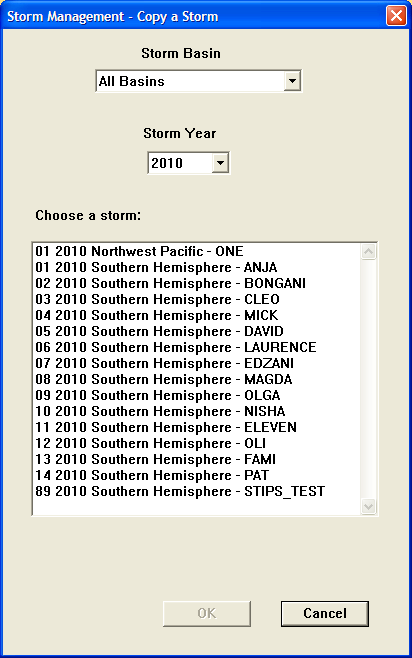
Storm Management – Copy a Storm Dialog
Select the Storm Basin and Storm Year, if desired. Then choose the storm to be copied and click on the OK button. The Copy a Storm dialog will then be displayed:
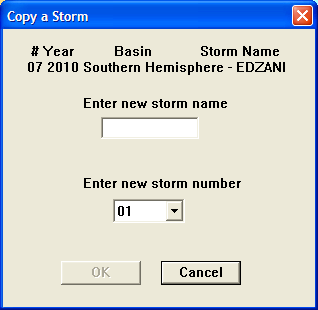
Copy a Storm Dialog
Enter the new name in the Enter new storm name box.
Select a new storm number (typically 80-89) in the Enter new storm number drop-down list. ATCF will not allow you to enter a new storm number that is already being used.
Click on the OK button to copy the storm.
Renumber a Storm… is generally used to re-number an existing 90-series storm (invest) to warning level numbers (i.e. 1-49). This is the procedure:
First close all of the applicable storm windows for the tropical cyclone being re-numbered.
Click on Renumber a Storm… in the Manage-Storms menu. This will open the Storm Management – Renumber a Storm dialog to allow you to select the storm to be re-numbered:

Storm Management – Renumber a Storm Dialog
Select the Storm Basin and Storm Year, if desired, then select a storm and click OK. The Renumber/Correct a Storm Dialog will be displayed:

Renumber/Correct a Storm Dialog
In this dialog, you can correct the storm name, storm number, storm state, wt number, etc. Click OK when done with changes.
Name an Existing Storm… is used to correct the storm name, etc. for an existing storm. This selection opens the Storm Management – Name an existing Storm dialog:
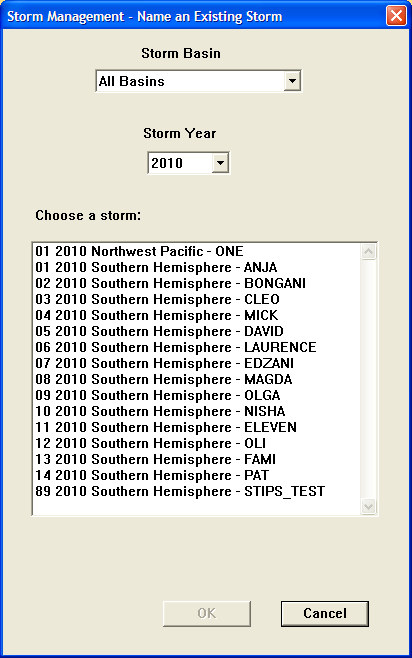
Storm Management – Name an Existing Storm Dialog
When you select a storm and click OK, the Rename/Correct a Storm dialog (see above) is displayed, and you can correct the storm name, storm number, storm state, wt number, etc. Click OK when done with changes.
Correct a Storm… functions the same as the prior two options. It opens a Storm Management – Correct a Storm dialog to allow you to choose a storm to correct, and then a Renumber/Correct a Storm dialog to make changes.
Restart a Storm… is used to restart a tropical cyclone that has regenerated, but can also be used to restart invests that have re-developed. Selecting this option opens the Storm Management – Restart a Storm dialog that allows you to select the storm to restart:
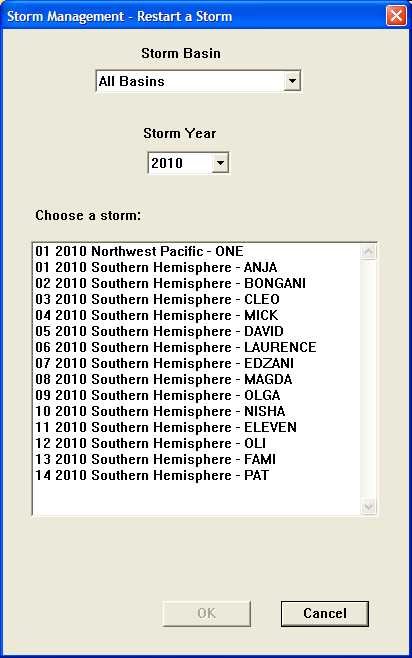
Storm Management – Restart a Storm Dialog
Upon selecting a storm and clicking the OK button, you will be presented with a confirmation dialog to actually restart the selected storm:
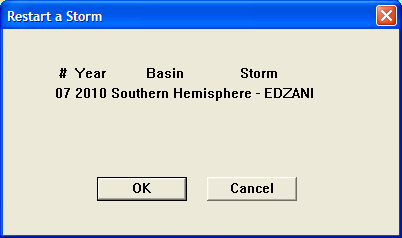
Restart a Storm Dialog
Click OK to restart the storm.
End a Storm… is typically used to end a storm in ATCF after the final warning and final fix have been completed. Ensure that you deactivate the storm first. To deactivate a storm, open the File menu, select Communicate with Other Site, and Deactivate Storm on NRL/FNMOC TC Page.
With the storm deactivated, click on End a Storm… in the Manage-Storms menu. Select the storm to be deactivated from the dialog presented, and click OK. You will then be presented with the End a Storm dialog:
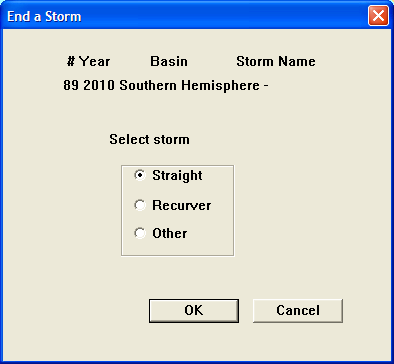
End a Storm Dialog
Select the storm type from the Select storm radio buttons, then click the OK button to end the storm.
Delete a Storm… must be used with great care and is typically used when removing invests (90-series) that to not develop into a TC. Prior to deleting, coordinate with the SATOPS Analyst since they must save all fixes before the storm can be deleted from ATCF. In the event that the storm is inadvertently deleted, the f-deck will have to be recovered from the backup sites and/or the fixes may have to be manually entered into ATCF – a very time consuming process!
A selection dialog is presented to allow you to select the storm to delete. When you click OK, a confirmation dialog will appear. You must click OK to delete the storm.
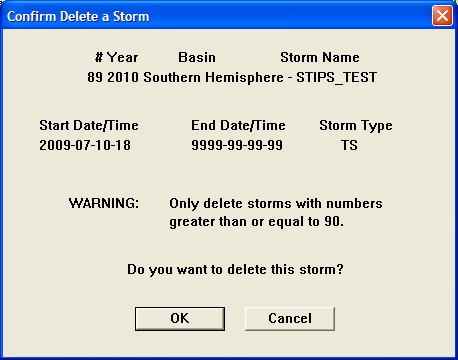
Confirm Delete a Storm Dialog
Cleanup Storms Directory… can be used to remove old storms from the directory. A selection dialog is displayed to allow you to select the storm(s) to be removed. You can select a single storm by clicking on it. To select a continuous range of storms, click on the first, hold down the Shift key, and click on the last storm in the range – the whole range will be highlighted. To select a non-continuous group of storms, click on the first, then hold down the Ctrl key while clicking each of the others. Selected storms will be highlighted. Clicking the OK button removes the storms from the directory – there is no confirmation dialog.
The Statistics menu contains functions to generate various statistics and calculate errors.
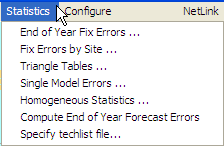
Statistics Menu
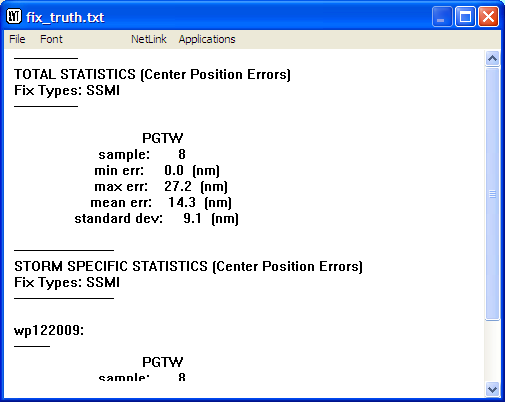
End of Year Fix Errors… provides a statistical analysis of satellite fixes as compared to the best track position. Selecting this function opens the End of Year Fix Errors dialog that allows you to run statistics by site (e.g. PGTW, KNES, etc), satellite type (MTSAT, TRMM, etc), and for a particular storm or multiple storms. Most of the selection options in this dialog are self-explanatory. To select an individual storm, just click on it to highlight it. To select a continuous group of storms from the list, click on the first, hold down the Shift key, and click on the last one in the list; all will be highlighted. To select multiple storms that are not grouped together in the list, click on the first, then hold the Ctrl key down and click on each of the others – all selected storms will be highlighted.
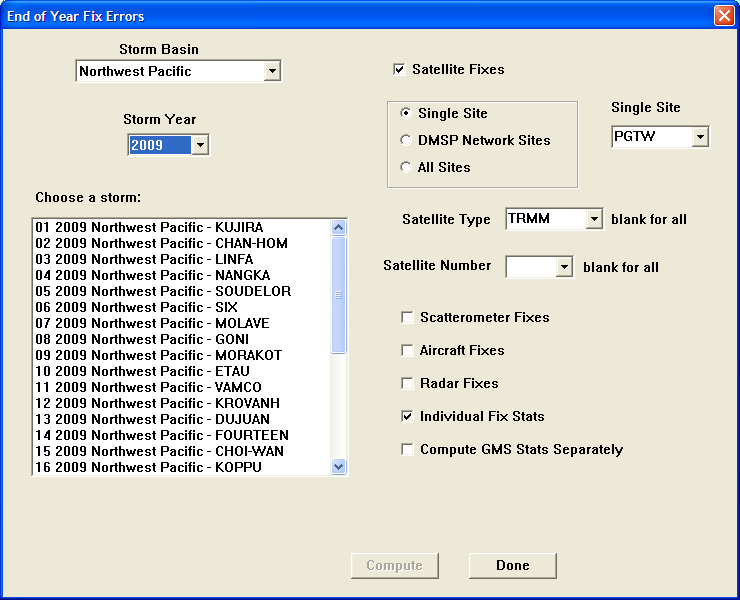
End of Year Fix Errors Dialog
The output of this function is a text window containing the fix error information:
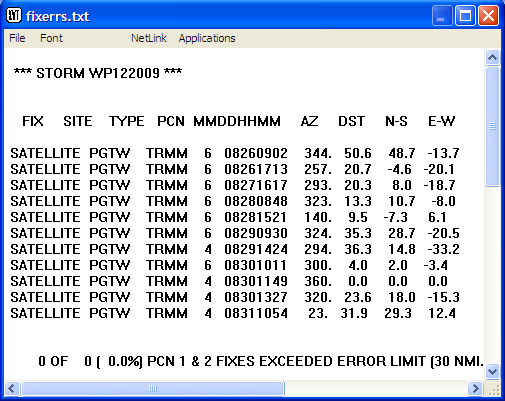
End of Year Fix Errors Window
You can print this list by opening the window’s File menu and selecting Print. To close the window, select Exit from its File menu.
Fix Errors by Site… allows the user to run fix statistics for a specific site (or multiple sites) and specific fix types (or multiple fix types) compared to an interpolated best track for a single storm or multiple storms. This option presents the Fix Errors by Site dialog:
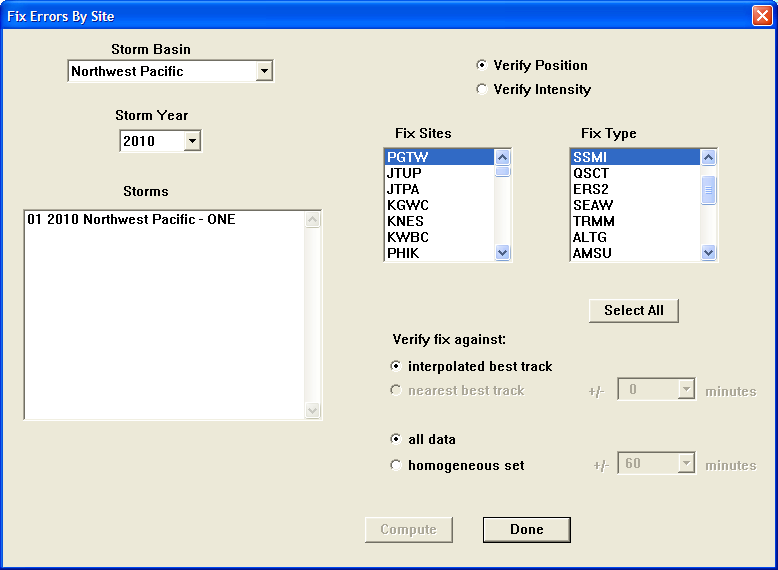
Fix Errors by Site Dialog
This dialog has three selection lists that allow multiple selections: Storms, Fix Sites, and Fix Type. In each of these lists, there are three selection options. To select an individual item, just click on it to highlight it. To select a continuous group of items from the list, click on the first, hold down the Shift key, and click on the last one in the list; all will be highlighted. To select multiple items that are not grouped together in the list, click on the first, then hold the Ctrl key down and click on each of the others – all selected items will be highlighted. Once all selections are made, click the Compute button to have the errors computed. The errors are displayed in a text window:
Fix Errors by Site Output
To print this list, open the window’s File menu and select Print. To close the window, select Exit from its File menu.
Triangle Tables… creates a number of files in the ‘storms’ directory of ATCF (adeck, bdeck, ddeck, edeck, and fdeck). Errors for selected categories will be output to the ddeck file. These are available for all aids (e.g. JTWC, AVNI, AVNO, EGRI, etc) for each forecast tau. Selecting the Triangle Tables… function opens the End of Year Triangle Table dialog:
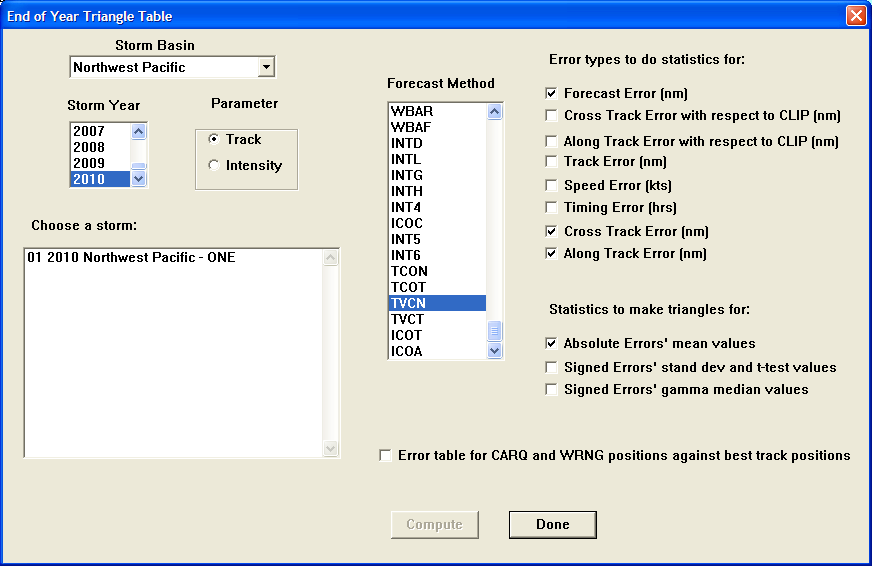
End of Year Triangle Table Dialog
In this dialog, you can select the Storm Basin, Storm Year, storm (Choose a storm) (multiple selections allowed), Forecast Method (multiple selections allowed), Error types to do statistics for, and Statistics to make triangles for. Click the Compute button to compute and display the statistics once all selections are made. The outputs are displayed in a text window:
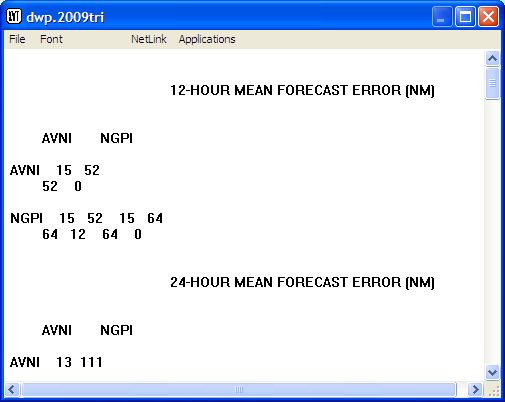
Triangle Tables Output Window
Primer on Triangle Table Statistics (Created by Barlow, Apr 2007)
*Note: Most commonly used statistics are in bold, highlighted, and have a larger font.
MEAN FORECAST ERROR (FTE) : Shortest distance between the forecast and verifying positions. This is not an absolute error measure since the verifying position is extracted from the 'best track' which is defined as a subjectively smoothed path produced in the post-storm analysis to represent the tropical cyclone movement (Tsui, 1988). FTE is further broken down into along-track-error (ATE) and cross-track-error (XTE) (see figure below).
STAND. DEV./T-TEST FORECAST ERROR (NM) : The F-test is used to detect whether a group of forecast aids is significantly different than the other aids. When only two aids are left in a group, the adjusted t-test of unequal variance and sample size is used to detect the significance of the difference between the two means (Tsui, 1988).
In probability and statistics, the standard deviation of a probability distribution, random variable, or population or multiset of values is a measure of the spread of its values. It is usually denoted with the letter σ (lower case sigma). It is defined as the square root of the variance. In other words, the standard deviation is the root mean square (RMS) deviation of values from their arithmetic mean.
For example, in the population {4, 8}, the mean is 6 and the standard deviation is 2. This may be written: {4, 8} ≈ 6±2. In this case 100% of the values in the population are at one standard deviation of the mean.
The standard deviation is the most common measure of statistical dispersion, measuring how widely spread the values in a data set are. If the data points are close to the mean, then the standard deviation is small. Conversely, if many data points are far from the mean, then the standard deviation is large. If all the data values are equal, then the standard deviation is zero.
DEV./T-TEST FORECAST ERROR (NM)
In mathematics and statistics, deviation is a measure of difference, for interval and ratio variables, between the observed value and the mean. The sign of deviation, either positive or negative, indicates whether the deviation is larger than or smaller than the mean. The magnitude of the value reports how different (in the relevant numerical scale)an observation is from the mean. One of the features of the mean is that the sum of the deviations across all observations is always zero.
Average deviation is calculated using the absolute value of deviation – it is the average of absolute values of the deviations.
Standard deviation is a more frequently used measure of average deviation.
A ttest is any statistical hypothesis test for two groups in which the test statistic has a Student's t distribution if the null hypothesis is true. [Note: A null hypothesis is a hypothesis set up to be nullified or refuted in order to support an alternate hypothesis. When used, the null hypothesis is presumed true until statistical evidence in the form of a hypothesis test indicates otherwise.]
GAMMA MEDIAN FORECAST ERROR (NM)
Gamma test tests the strength of association of the cross tabulations when both variables are measured at the ordinal level. It makes no adjustment for either table size or ties. Values range from -1 (100% negative association, or perfect inversion) to +1 (100% positive association, or perfect agreement). A value of zero indicates the absence of association.
The following statistics add limited benefit to today’s forecasting operations aside from potential, limited research applications, but are still available in ATCF.
MEAN CROSS TRACK ERROR WRT CLIP (NM)
STAND. DEV./T-TEST CROSS TRACK ERROR WRT CLIP (NM)
GAMMA MEDIAN CROSS TRACK ERROR WRT CLIP (NM)
MEAN ALONG TRACK ERROR WRT CLIP (NM)
STAND. DEV./T-TEST ALONG TRACK ERROR WRT CLIP (NM)
GAMMA MEDIAN ALONG TRACK ERROR WRT CLIP (NM)
*Note: The Mean Track Error, Mean Speed Error, and Mean Timing Error are rarely used anymore but were used and referenced in Tsui papers and the 1984 ATCR.
MEAN TRACK ERROR (NM): Defined as the shortest distance between the forecast position and the best track. Usually the track errors are perpendicular to the best track (Tsui, 1984).
STAND. DEV./T-TEST TRACK ERROR (NM)
GAMMA MEDIAN TRACK ERROR (NM)
MEAN SPEED ERROR (KTS): Defined as the speed difference between the storm traveling along the best track and that of the forecast track. Positive value of this quantity indicates the forecast storm speed is faster than the verified speed (Tsui, 1984).
STAND. DEV./T-TEST SPEED ERROR (KTS)
GAMMA MEDIAN SPEED ERROR (KTS)
MEAN TIMING ERROR (HRS): Defined as the time difference between the verified time and the forecast time projected by the TKE (Tsui, 1984).
STAND. DEV./T-TEST TIMING ERROR (HRS)
GAMMA MEDIAN TIMING ERROR (HRS)
MEAN CROSS TRACK ERROR (NM) : One of two components of forecast track error decomposed in the natural coordinate system. The origin of the coordinate system is placed on the verifying position, and the orientation of the natural coordinate is placed along with the instantaneous motion vector of the best track during the immediate past hour (Tsui, 1988).
STAND. DEV./T-TEST CROSS TRACK ERROR (NM)
GAMMA MEDIAN CROSS TRACK ERROR (NM)
MEAN ALONG TRACK ERROR (NM) : ATE provides information on the accuracy of the speed forecast by comparing the aid against the JTWC best track to get the speed bias. ATE, however, cannot be treated alone to indicate the speed bias of a technique, since ATE is only a projection of the forecast track (Tsui, 1988). In other words, ATE compares the aid to best track to get speed bias but doesn’t compare absolute speeds of the aid vs. absolute speed of best track from one time to the next
STAND. DEV./T-TEST ALONG TRACK ERROR (NM)
GAMMA MEDIAN ALONG TRACK ERROR (NM)
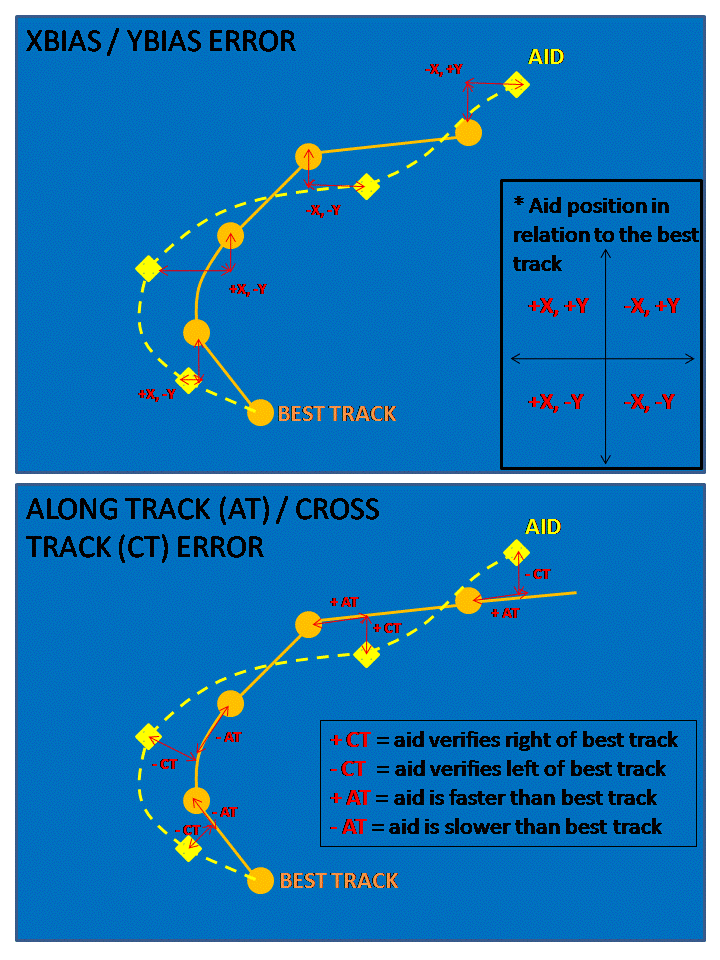
Single Model Errors… is used to compute Annex A tables for a single model and one or more storms. This option opens the Compute End of Year Annex A Table dialog, which allows you to select the Storm Basin, Storm Year, and one or more storms (multiple selections are allowed in the Choose storms list). The Forecast Method list contains the aids for which statistics can be computed – only one selection at a time is possible in this list. Click on the Compute button when all selections have been made.
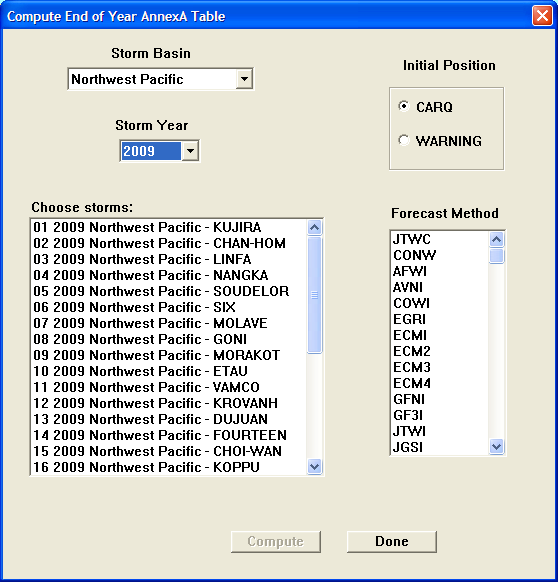
Compute End of Year Annex A Table Dialog
The output is presented in a text window:
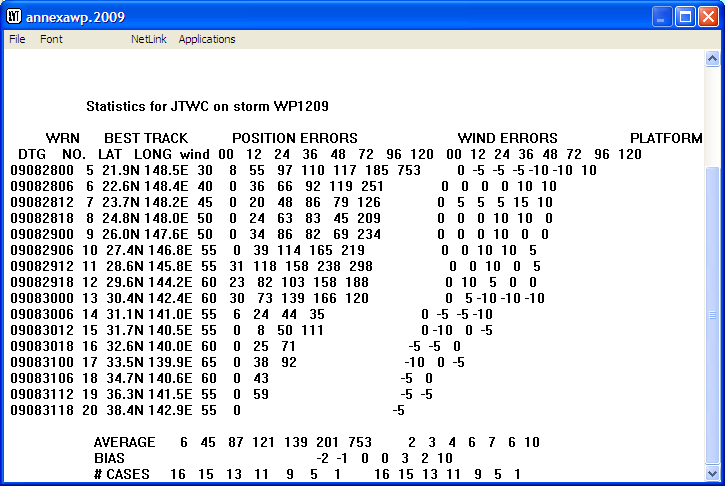
Single Model Errors Output
Homogeneous Statistics… allows the user to calculate track, intensity, and wind radii error statistics for one or more storms and one or more forecast methods (aids). This option opens the Compute Homogeneous Statistics dialog:
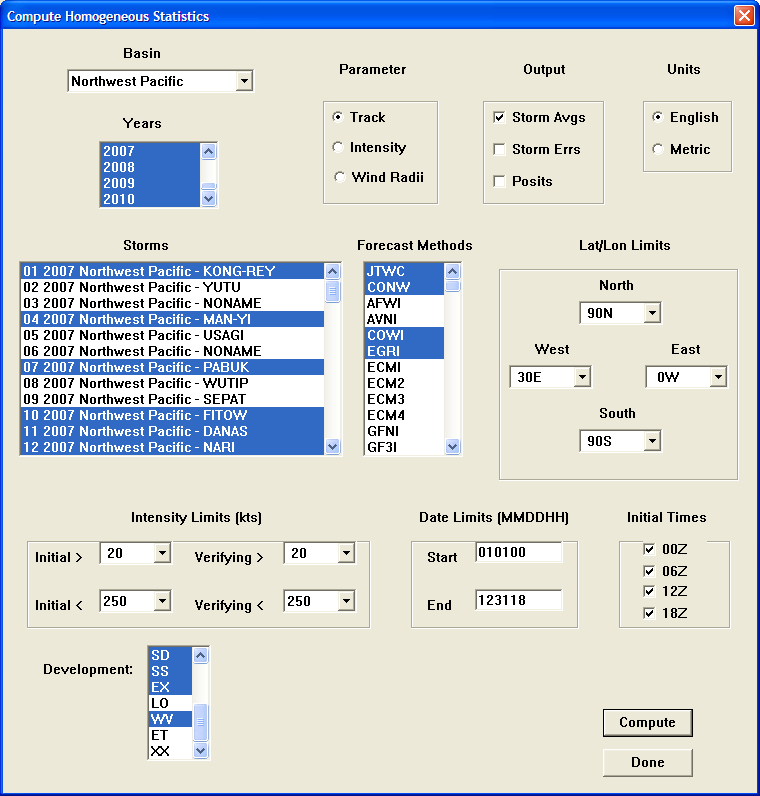
Compute Homogeneous Statistics Dialog
As shown in the example above, there are four selection lists that allow multiple selections: Years, Storms, Forecast Methods, and Development. In each of these lists, there are three selection options. To select an individual item, just click on it to highlight it. To select a continuous group of items from the list, click on the first, hold down the Shift key, and click on the last one in the list; all will be highlighted. To select multiple items that are not grouped together in the list, click on the first, then hold the Ctrl key down and click on each of the others – all selected items will be highlighted. The other selections are self-explanatory. When all selections have been made, click on the Compute button to calculate the statistics.
The outputs are displayed in a text window:
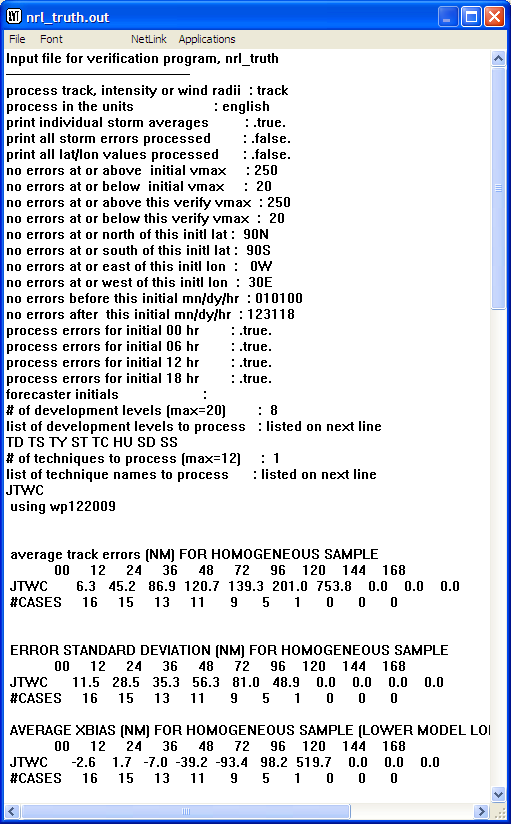
Homogeneous Statistics Output
Compute End of Year Forecast Errors produces a text window display of the end of year forecast errors:
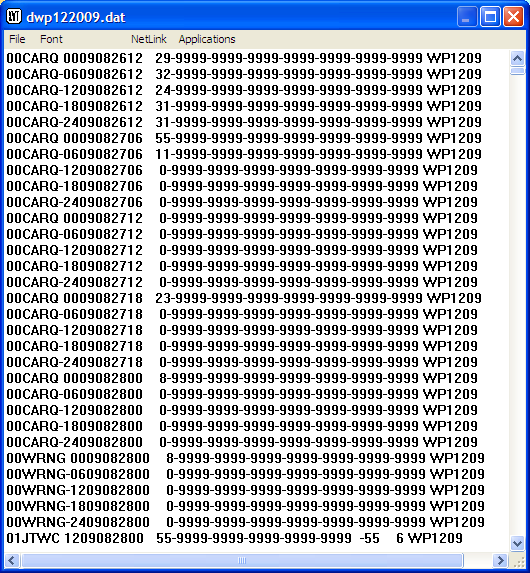
Compute End of Year Forecast Errors Output
Specify techlist file… opens a selection dialog that allows you to select a techlist file:
Select a techlist file Dialog
The Configure menu presents various options that allow you to configure the ATCF displays, options, and defaults. Of these available tasks, many should not be attempted by the casual user without first consulting your ATCF administrator. Many of the changes done within the Configure section will be global and apply to all ATCF users. Caution should be used when making changes in this section.
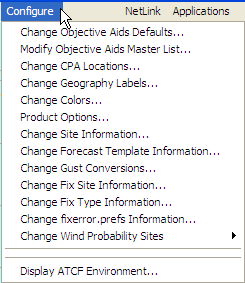
Configure Menu
Change Objective Aids Defaults… allows you to change the suite of objective aids that will be included by default in the aids and consensus displays. This information should not be changed without first consulting with your ATCF Administrator as each location has developed its default lists for forecasting based on experience. Selecting this option opens the Change Objective Aids Defaults dialog, which displays the master list of aids at the top left and the default aids list at the top right. To add an aid to the default list, highlight it in the master list and click the Add button. To remove an aid from the default list, highlight it in the default list and click the Delete button. The Clear All button clears all the aids from the default list and should be used with great caution because the list will then need to be rebuilt from scratch. The OK button accepts the changes and closes the dialog; the Cancel button exits without making the changes.
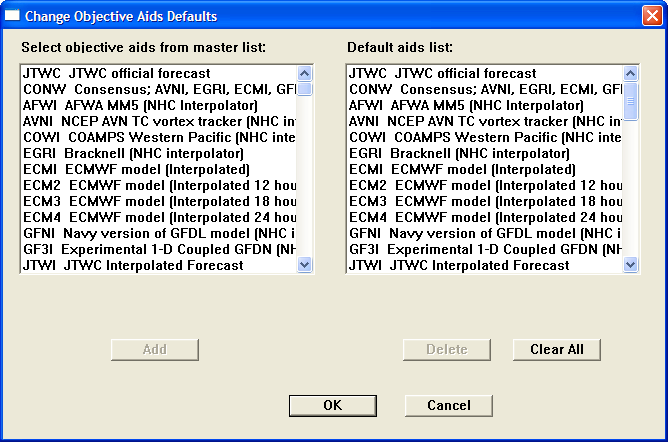
Change Objective Aids Defaults Dialog
Modify Objective Aids Master List… presents the Objective Aids Master List in an editable text window in which changes may be made. This should not be done except by the ATCF Administrator as the list must be precisely formatted.
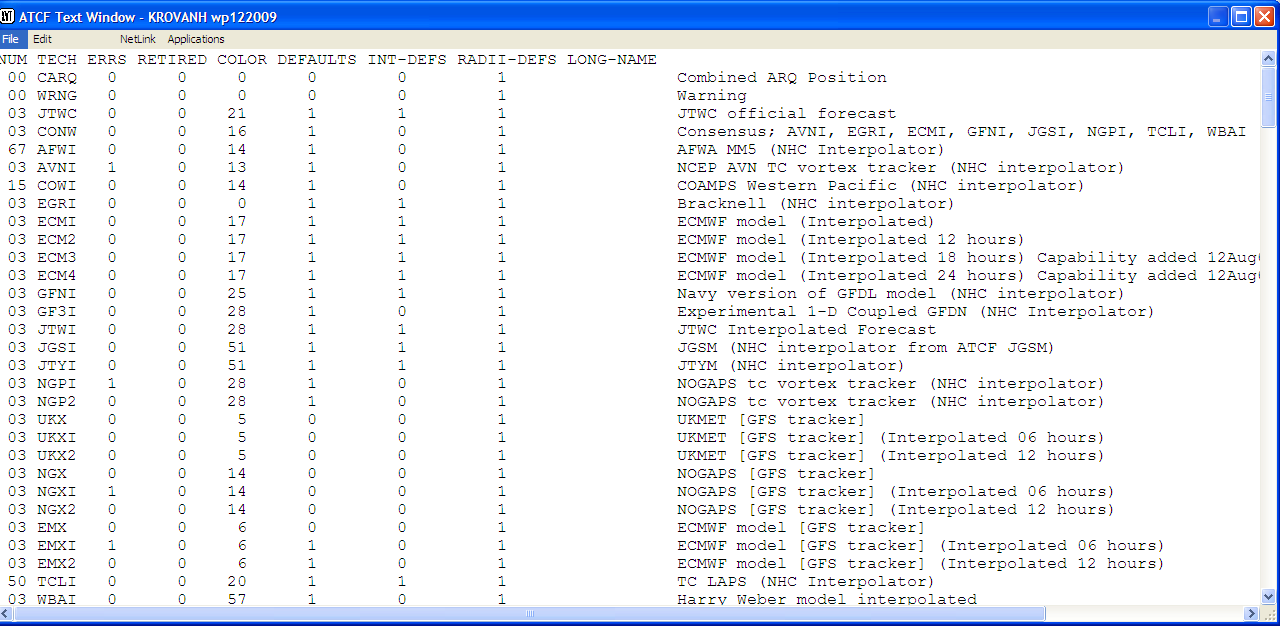
Edit Objective Aids Master List Window
The window’s File menu contains options to Print, Print Landscape, Save, Save As, and Exit. The file must be saved for the changes to go into effect.
Change CPA Locations… is used to add locations to which CPAs will be calculated, or to modify existing locations. This option opens the Change CPA Locations dialog:
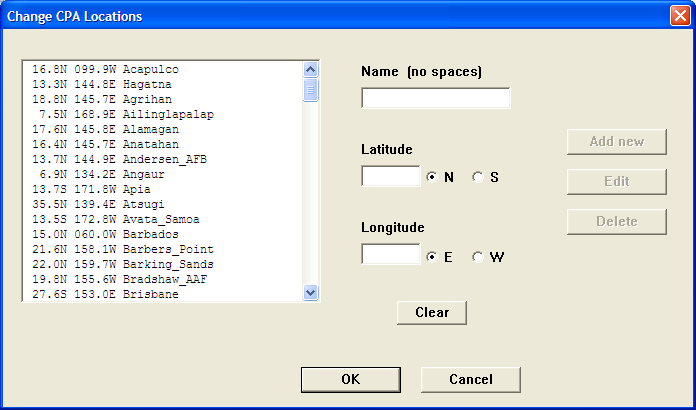
Change CPA Locations Dialog
The list box on the left shows the current CPA locations list. To enter a new location, fill in the Name, Latitude, and Longitude boxes (make sure the hemispheres are correct) and click on the Add new button. To delete a location, click to highlight it in the list box and then click on the Delete button. To edit a location, highlight it in the list box and click on the Edit button. This clears the information in the entry boxes; you can then enter new information and click the Add New button to make the change. You may then change the information using the same entries you use to create a new location. The Clear button clears the Name, Latitude, and Longitude boxes and returns the hemisphere radio buttons to the defaults (N and E). To exit the dialog once you are finished making entries, click on the OK button. Note that while the list is updated when you click the Add New or Delete buttons, the changes do not actually become final until you click on the OK button. The Cancel button exits without making any changes.
Change Geography Labels… allows you to add and modify existing geography labels in an editable text window. Be extremely careful when modifying entries.
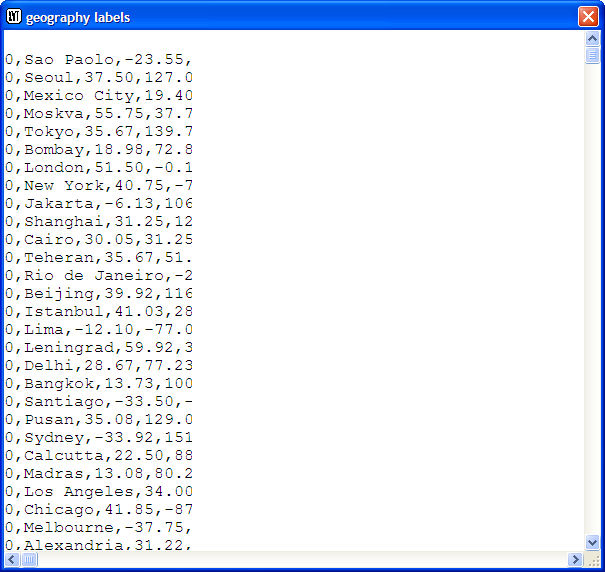
Change Geography Labels Window
The window’s File menu contains options to Print, Print Landscape, Save, Save As, and Exit. The file must be saved for the changes to go into effect.
Change Colors… opens the Map Display Color Preferences dialog:
Map Display Color Preferences Dialog
This dialog allows modification of screen colors, printer colors, and plotter colors as desired (the radio buttons at the top left select which set of colors is being modified). Keep in mind that changes will affect all users so remember to change back to the original colors.
To change the color for a map feature, click on the feature in the columns on the left side or the rows in the middle, then click on the desired color for that feature in the Color Table columns on the right. The feature’s color swatch will then change. You can use the Color Table… button to change the color table swatches; this opens the Color Table dialog:
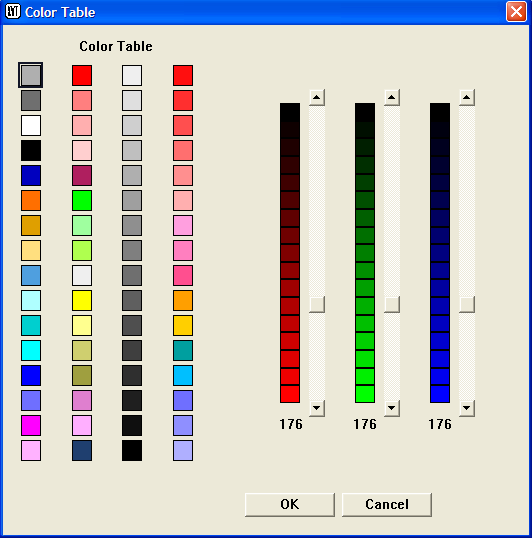
Color Table Dialog
To change a color table swatch, click on it and then use the sliders (red, green, blue) on the right side to adjust the color. Click OK when done to make the change.
To change the colors assigned to various objective aids, use the Obj Aids Colors… button in the Map Display Color Preferences dialog. This opens the Obj Aids Color Preferences dialog:
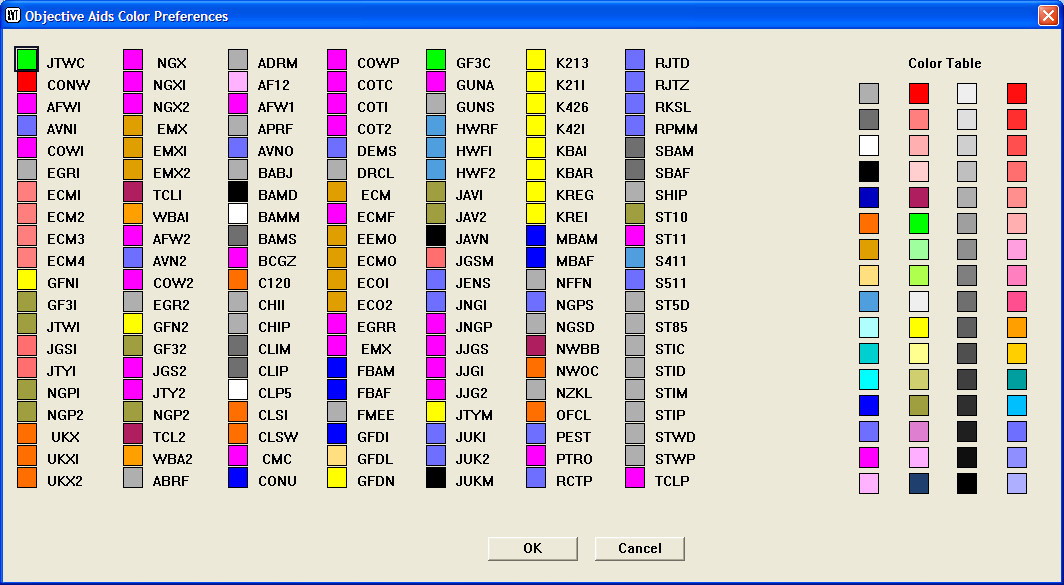
Objective Aids Color Preferences Dialog
To change the color assigned to an objective aid, click its color swatch and then click the desired color in the color table swatches on the right. Click OK to make the change and close the dialog, or Cancel to exit without changes.
Product Options... is used to change the way certain products are displayed; for example, whether winds are displayed with isotachs or streamlines, and whether surface pressure is displayed with altimeter settings. It can also change contour and color fill options and the station model used for displaying surface reports. The Product Options dialog is shown below:
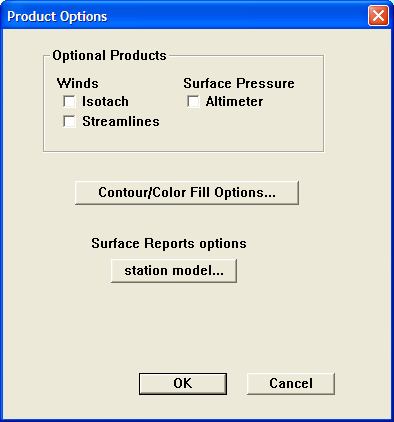
Product Options Dialog
The Optional Products box at the top contains check boxes for the optional products: isotachs and streamlines for winds, and altimeter settings for surface pressure.
The Contour/Color Fill Options… button is used to change the way selected parameters are displayed on the map. It opens the Contour Options dialog shown below. Clicking on a product in the list box on the left will show you how it is currently displayed. You can use the options on the right side to change the display method by changing the Start value and Stop value (these set the lowest and highest values of the parameter that will be plotted) and the Interval (which changes the spacing between the contour lines). You can also change the way a product is displayed by changing from Contour to Color Fill or vice versa using the radio buttons at the top right. If Color Fill is selected, the Color Fill Options button will be enabled (see below). Click on Apply to apply the changes temporarily. Click on OK to make the changes permanent and close the dialog. Click on Cancel to exit without making any changes.
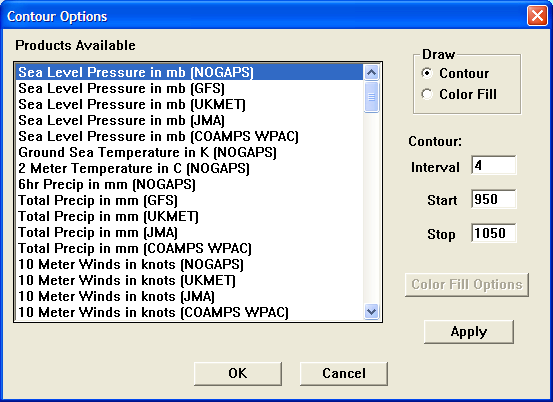
Contour Options Dialog
Clicking the Color Fill Options button (active when the Color Fill radio button is selected at the top) opens the Color Fill Settings dialog:
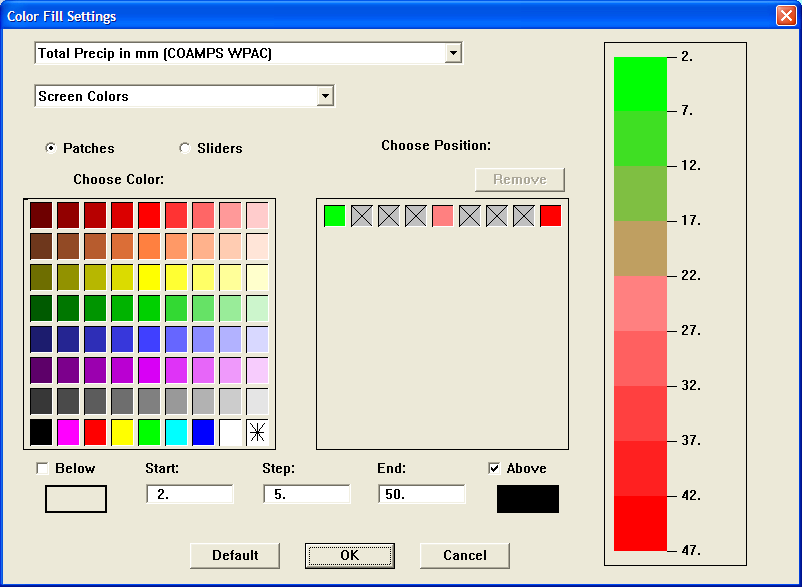
Color Fill Settings Dialog
This dialog is used to set the range of colors used in a color-filled contour display. The display on the right shows what the color fills will look like.
You can change the parameter that options are being set for using the list box at the top left. Below that is a selector for which colors (screen, printer, or screen and printer) are being set. The Patches and Sliders radio buttons select the method you use to choose colors – Patches (shown) is the easiest to use because you just click on a color. Sliders presents red, green, and blue sliders that are adjusted in combination to create a color.
The Choose Position box in the center is used to designate colors at various points in the continuum. The position at the left end shows the color for the lowest value to be plotted, the one on the right shows the color for the highest value, and points between are used to establish the desired gradation of colors. The number of positions will change based on the settings below.
Below the Choose Position box are entry boxes that allow you to set the range of values to be plotted, and assign colors if desired for values above and below the range. If you want to assign a color to values below the range, check the Below checkbox and pick a color in the swatch box below it. The Start and Stop entry boxes are used to establish the end points of the range of values to be plotted, and the Step entry box establishes the step between color fills. The Above box is to be checked if you want to assign a color to values above the range; assign the color by clicking in the swatch box below.
The Default button returns all values to their defaults, which may vary depending on the parameter being plotted. The OK button accepts the changes you have made and closes the dialog. The Cancel button exits without making any changes.
The station model… button opens an edit window that allows you to change the station model display settings. The top line of the file contains 19 switches that turn on and off the display of various features. This is the portion of the file you will be editing. Below the switches line are instructions on how to edit the file. Each of the 19 switches controls the display of one of the parameters listed below. If the switch position contains a 1, the item will be displayed in the station model; if it contains a 0, the item will not be displayed. All selected items will be displayed in their standard positions in the station model.
The File menu of the edit window contains options to Print, Print Landscape, Save, Save As, and Exit. If you exit without saving, your changes will not take effect.
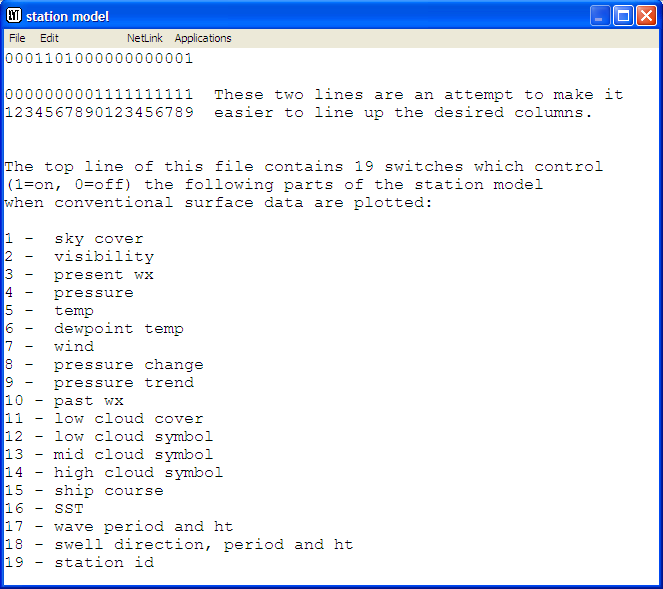
Station Model Edit Window
Change Site Information… is used to change information pertaining to a single site. The site information is shown in an edit window with instructions at the top. The actual site information is below the START_OF_DATA line in the lower middle portion of the file.
The File menu of the edit window contains options to Print, Print Landscape, Save, Save As, and Exit. If you exit without saving, your changes will not take effect.
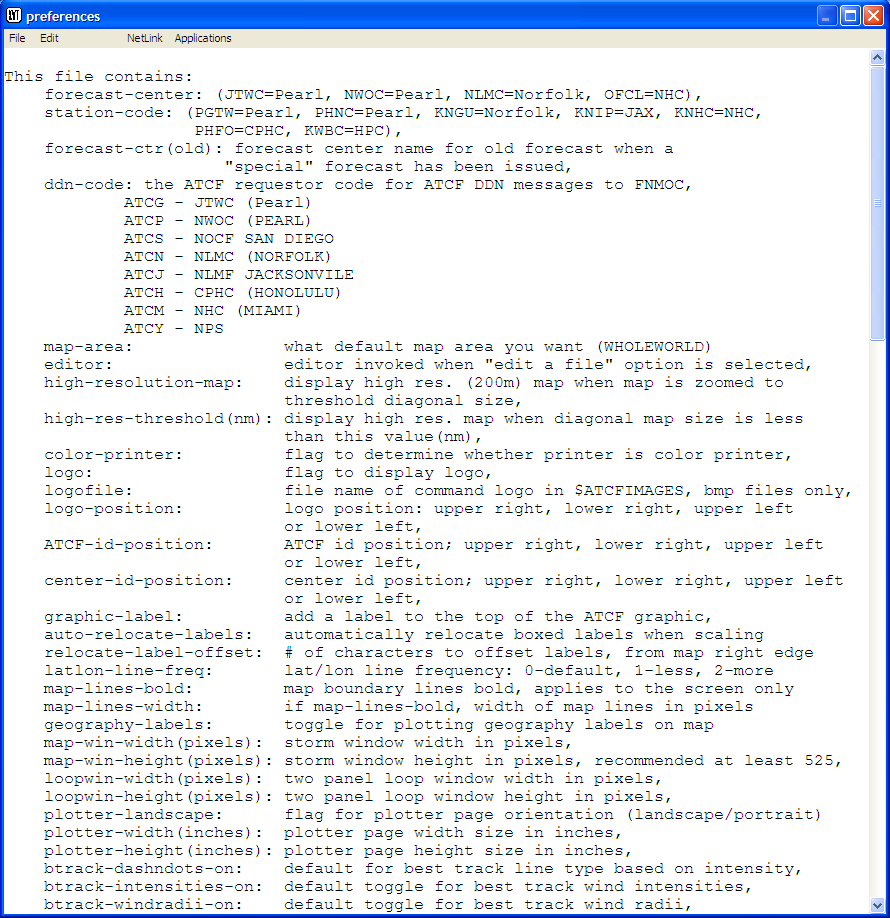
Change Site Information Edit Window
Change Forecast Template Information… is used to change the defaults for displaying forecast information (e.g. the radii of circles around the forecast positions, positioning of labels, etc). The template information is shown in an edit window with instructions at the top. The actual template information is below the START_OF_DATA line in the lower middle portion of the file.
The File menu of the edit window contains options to Print, Print Landscape, Save, Save As, and Exit. If you exit without saving, your changes will not take effect.
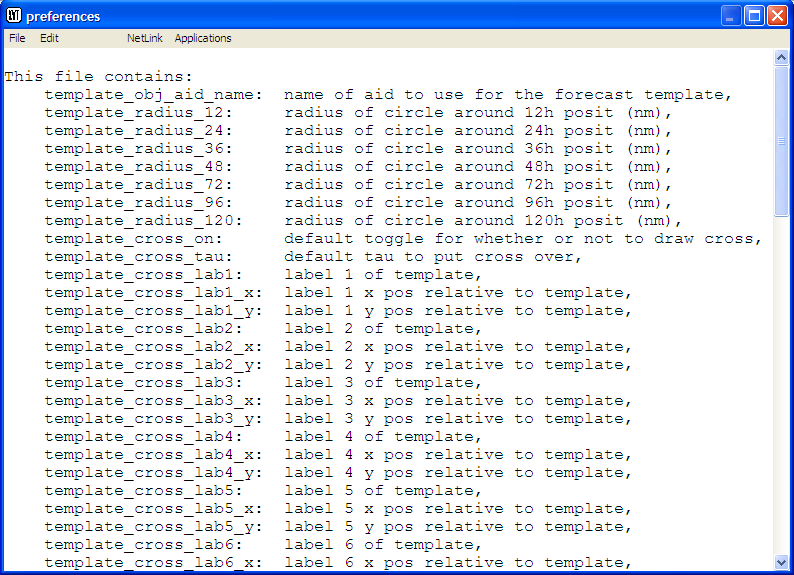
Change Forecast Template Information Edit Window
Change Gust Conversions… is used to change the wind gust speed to be reported for various sustained wind speeds. The gust conversion information is shown in an edit window with instructions at the top. The actual conversion information is below the START_OF_DATA line in the lower middle portion of the file.
The File menu of the edit window contains options to Print, Print Landscape, Save, Save As, and Exit. If you exit without saving, your changes will not take effect.
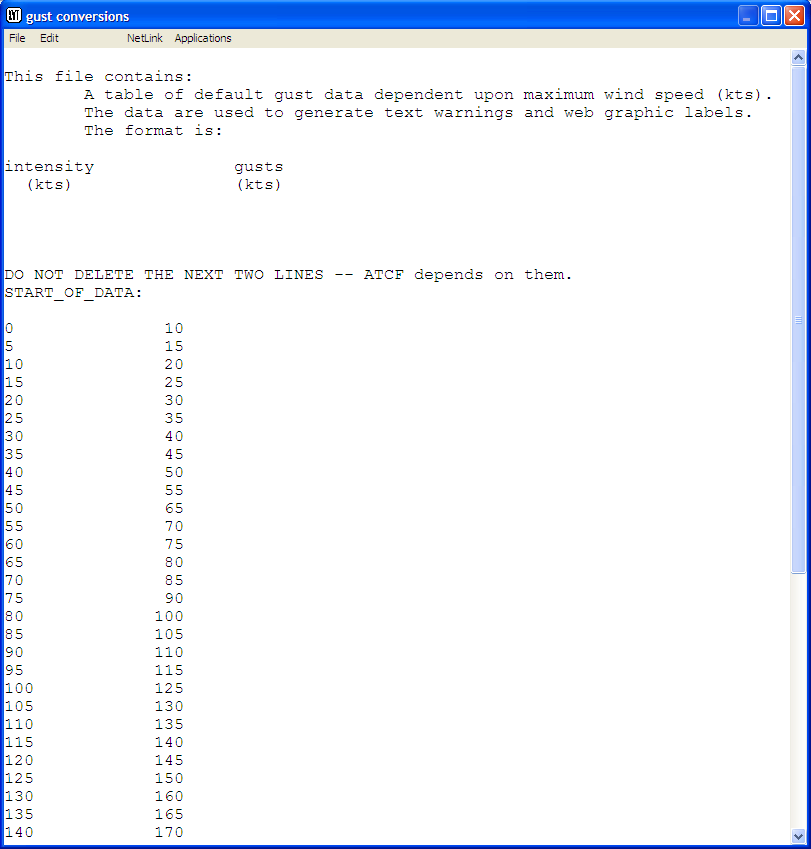
Change Gust Conversions Edit Window
Change Fix Sites Information… is used to change fix sites used for entering and displaying satellite fixes and for computing error statistics.
The fix site information is shown in an edit window with instructions at the top. The actual fix site information is below the START_OF_DATA line in the lower middle portion of the file.
The File menu of the edit window contains options to Print, Print Landscape, Save, Save As, and Exit. If you exit without saving, your changes will not take effect.

Change Fix Site Information Edit Window
Change Fix Type Information… is used to change fix type information used for displaying fixes and for computing error statistics. The fix type information is shown in an edit window with instructions at the top. The actual fix type information is below the START_OF_DATA line in the lower middle portion of the file.
The File menu of the edit window contains options to Print, Print Landscape, Save, Save As, and Exit. If you exit without saving, your changes will not take effect.
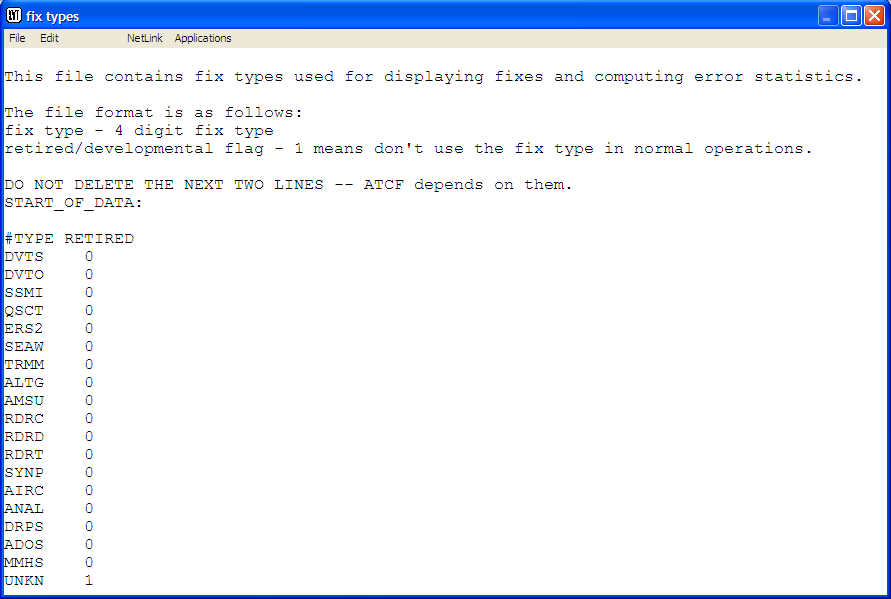
Change Fix Type Information Edit Window
Change fixerr.prefs Information… presents in an edit window the fixerr.prefs file. This file contains the fix types and sites that are designated as research or experimental fixes. This is also the objective best track input file. It contains options for curve fitting to data and overrides for the fix weights. By specifying a particular fix type, site name, and average fix error you override the generic weights assigned to fixes of that type.
The fix type information is shown in an edit window with instructions at the top. The actual fix type information is below the START_OF_DATA line in the lower middle portion of the file.
The File menu of the edit window contains options to Print, Print Landscape, Save, Save As, and Exit. If you exit without saving, your changes will not take effect.
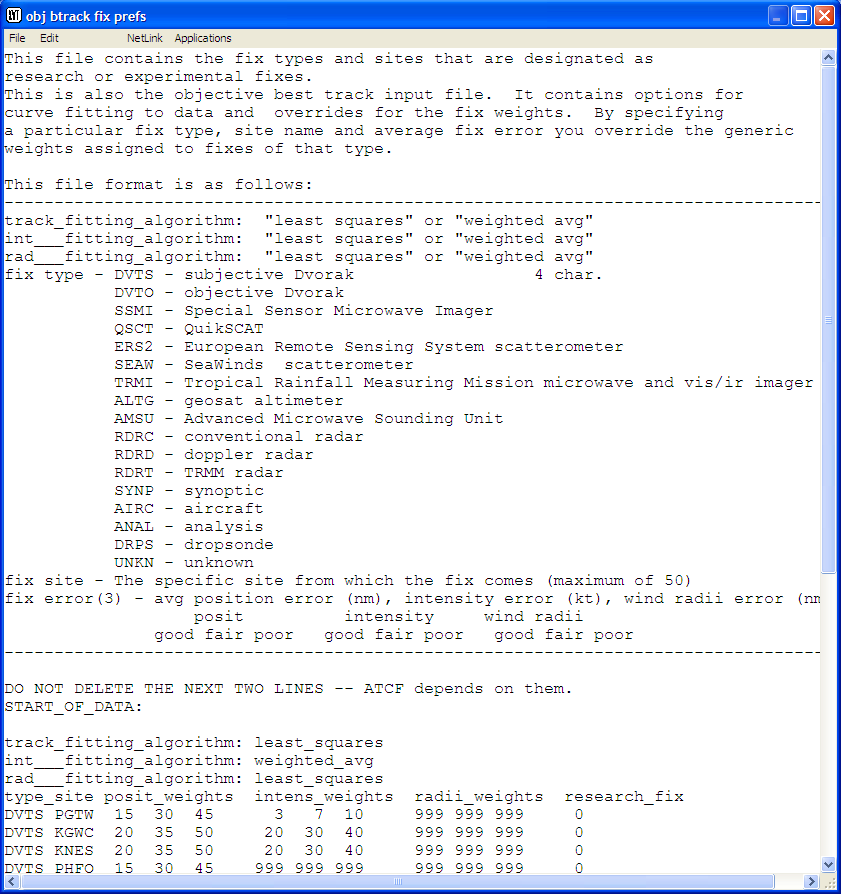
Change fixerr.dat Information Edit Window
Change Wind Probability Sites is used to change the locations for which wind probabilities will be calculated. Selecting this option (or hovering the cursor over it) opens a flyout menu allowing you to select the basin in which sites are to be edited. When you select a basin, that basin’s site list will be displayed in an edit window. Editing of wind probability sites is best left to the ATCF Administrator, as it is sensitive to position and punctuation and no guidance is given in the file concerning the correct format.
The File menu of the edit window contains options to Print, Print Landscape, Save, Save As, and Exit. If you exit without saving, your changes will not take effect.
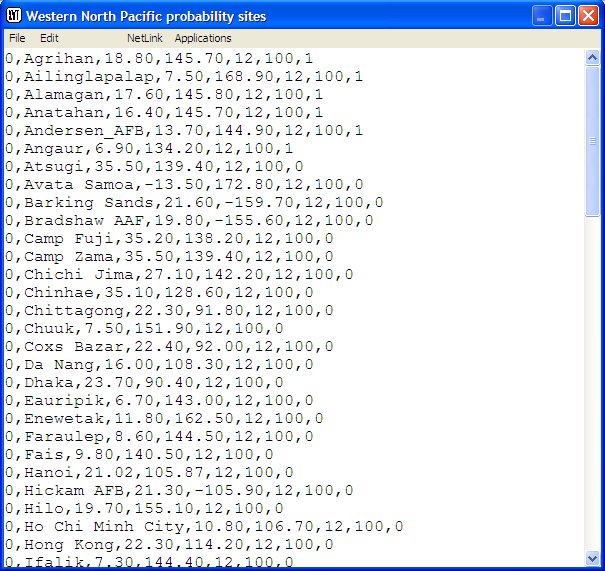
Western North Pacific Wind Probability Sites Edit Window
Display ATCF Environment… opens a text window showing the current ATCF environment (e.g. file and database locations, operating system, etc).
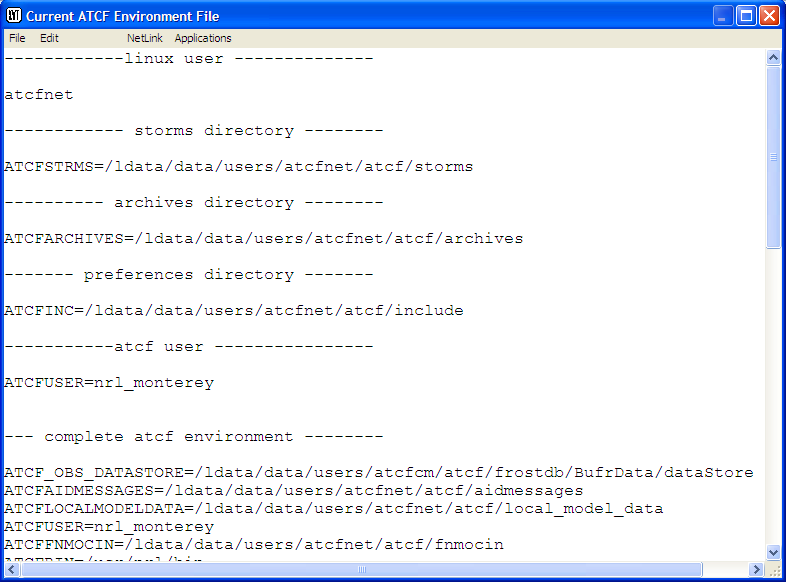
Display ATCF Environment Output
The Help menu presents information on using help, help on keys, a contents menu with links to various topics, and information on the version of ATCF currently in use .